Most dips are not planets
Of more than 8,000 TESS Objects of Interest, over 2,000 have already turned out to be false positives (TESS planet count). The biggest culprit is the eclipsing binary (EB): two stars orbiting each other, whose eclipses can look exactly like a transit. Vetting looks for the fingerprints a binary leaves that a planet cannot.
Every uncertainty in these tests is first inflated by a red-noise factor \(\beta\): the scatter of binned out-of-transit data divided by what white noise would give. On a star with correlated noise, \(\beta > 1\) makes each test harder to fail by chance.
First, drop a bad transit
Most tests compare averages over many transits, and one transit that sits on an instrumental ramp can move an average by far more than its uncertainty. So before the fit and the tests, the pipeline measures every transit on its own: the depth is the median flux of the flanks (0.75 to 2 durations from mid-transit) minus the median of the central 70 % of the transit, which needs no transit model. With at least six transits measured, one whose depth lies more than 5 times the scatter from the median is left out. The scatter is the larger of the depths’ robust spread (1.4826 × their median absolute deviation) and their typical uncertainty. Outliers must be rare: if more than a tenth of the transits stand out, none is dropped. That protects an eclipsing binary found at half its period, whose alternating eclipses form two groups of depths, and a whole group would otherwise be edited away. Every dropped transit is listed in the report with its depth and the step in the out-of-transit level across it.
The nine tests
Odd/even depths
Two similar stars eclipse each other twice per orbit, so BLS often locks on at half the true period, and “odd” and “even” transits are really two different eclipses. The pipeline fits the transit amplitude separately to odd and even epochs. Each transit is measured against its own surroundings, the median flux within 1.5 durations of it, so that a detrending residual that shifts the flux around one transit is not mistaken for a change of depth; the uncertainty of those reference levels is included.
\[\frac{\lvert\delta_{\text{odd}} - \delta_{\text{even}}\rvert}{\sqrt{\sigma_{\text{odd}}^2 + \sigma_{\text{even}}^2}} > 3 \;\Rightarrow\; \text{fail}\]The white-noise uncertainty of an average over dozens of transits is tiny, but real transits also differ from one another: instrumental systematics and starspots change each one by a little. At a S/N of several hundred, a difference of one percent between odd and even averages can then look significant. So when each parity has at least three transits, the uncertainty of each average is raised, if needed, to the scatter of single-transit depths about their own parity’s median, divided by the square root of their number. Taking the scatter within each parity matters: an eclipsing binary’s alternating depths would otherwise inflate it and hide the binary.
Secondary eclipse
A binary’s second star is often luminous enough to show a dip at phase 0.5. But a hot planet can show a small one too (its occultation), so a significant (≥ 3σ) secondary only fails if it is deeper than twice the largest plausible planetary occultation, reflected light plus thermal emission:
With geometric albedo \(A_g = 1\), a dayside with no heat redistribution, and blackbodies integrated over the 600–1000 nm TESS band. Deliberately generous, so real hot Jupiters like WASP-18 b pass.
For eccentric orbits the secondary can fall anywhere, so a box is also scanned over all phases. There a dip has to reach 5σ (stricter, because many phases are tried) and exceed the same limit.
A real eclipse repeats every orbit; a single instrumental dip does not, yet averaged over the folded light curve it can reach 5σ. So a dip, at phase 0.5 or anywhere in the scan, only counts if it stays significant when the orbit that contributes most to it is left out. Dips that fail this are reported in the test’s message (“comes from a single orbit”) but do not affect the outcome.
Transit shape
A trapezoid is fitted to the folded transit. The metric is the fraction of the duration spent in ingress and egress, \((T_{14} - T_{23})/T_{14}\): 0 for a box, 1 for a “V”. Grazing binaries are V-shaped, but so are grazing planets, so a value ≥ 0.8, or a posterior probability of grazing \(P(b + k > 1) > 0.5\), is only a warning.
Stellar density
The fit measured the star’s density from the transit alone. If the “planet” is really orbiting a different, larger star (a blended background binary, or a giant), that density won’t match the catalog. The comparison is made in log space:
\[\frac{\lvert \ln\rho_{\text{transit}} - \ln\rho_{\text{TIC}} \rvert}{\sigma_{\ln\rho}} > 3 \;\Rightarrow\; \text{warn}, \qquad \text{and a ratio beyond } 5\times \;\Rightarrow\; \text{fail}\]That form holds for a posterior shaped like a normal distribution in ln ρ. In general the significance is the posterior probability that the transit-implied density lies at or beyond the catalog value, with the catalog’s uncertainty folded in, converted to Gaussian standard deviations. For a well-behaved posterior the two are the same number. The second stays right when a fit wanders between a grazing and a non-grazing solution: the posterior then has two modes, and their combined width would hide a mismatch that no single sample comes near (see the binary in L 98-59’s light curve).
The factor of 5 leaves room for eccentric orbits, which the circular fit can’t model and which alone bias the density by
\[\frac{\rho_{\text{circ}}}{\rho_{\text{true}}} = \left(\frac{1 + e\sin\omega}{\sqrt{1 - e^2}}\right)^{3}.\]Radius
A companion larger than 2.5 Jupiter radii is not a planet.
Data coverage
A transit needs data inside it and on both sides. Right after a gap (the start of an orbit or a sector) and just before one, the spacecraft’s systematics are at their worst, and two truncated dips at such edges, years apart, can pair up into a convincing long-period “planet”. A transit counts as covered if data exist for at least 75 % of its duration and for half of a one-duration window on each side. A signal with no covered transit fails; one that rests on a single covered transit gets a warning.
Momentum dumps
Every few days TESS fires its thrusters to unload its reaction wheels. The jolt to the pointing lasts minutes, and those cadences are flagged and removed, but around a dump light can shift between the apertures of neighboring stars for an hour or so, and a search can line several such dips up at a period. On the first night of the batch search, TIC 100103201 gave a 12.03-day signal at S/N 13.1, with a clean flat-bottomed fold, that the other tests let through. Its three deep transits each fell within an hour of a dump; at the same moments its twin, a star of the same brightness 16″ away in the same TESS pixel, brightened; and the two transits away from the dumps were flat. The 2-minute data of later years do not show the signal.
The light curve’s quality flags give the dump times. A transit is at a dump when the dump falls inside it or within an hour of it. Each transit’s depth is measured against its own surroundings, as for dropping a bad transit, and the transits at dumps are compared with the others:
- at dumps at least 3σ deeper, and the others show no dip at 3σ: fail, the dip comes from the dumps;
- at dumps at least 3σ deeper, but the others show the dip too: warning, a real transit that a dump distorted;
- every transit at a dump: fail if chance would do that less than 1 % of the time (the share of the data near a dump, to the power of the number of transits), else a warning.
Values from results/calibration/momentum_dumps.md, written by
scripts/check_momentum_dumps.py from the stored real-data results. The test passes all 23
confirmed planets of the validation and the
resolved TOIs. Fourteen of them have
transits at dumps, up to 8 of L 98-59 b’s 234, and the depths there agree with the rest. One of
HD 21749 c’s transits sits at a dump and is 3340 ppm deep against the planet’s 180: the
pipeline leaves such a transit out before the tests (above), and
the test alone would only warn, since the other 43 transits show the dip. It passes the 12
recovered false positives too, eclipsing binaries that the other tests are for, and the two
near-threshold false alarms on 100 stars without planets,
which are not dump artifacts. It is aimed at one kind of artifact that the other tests let
through.
Centroid: is the dip on the target?
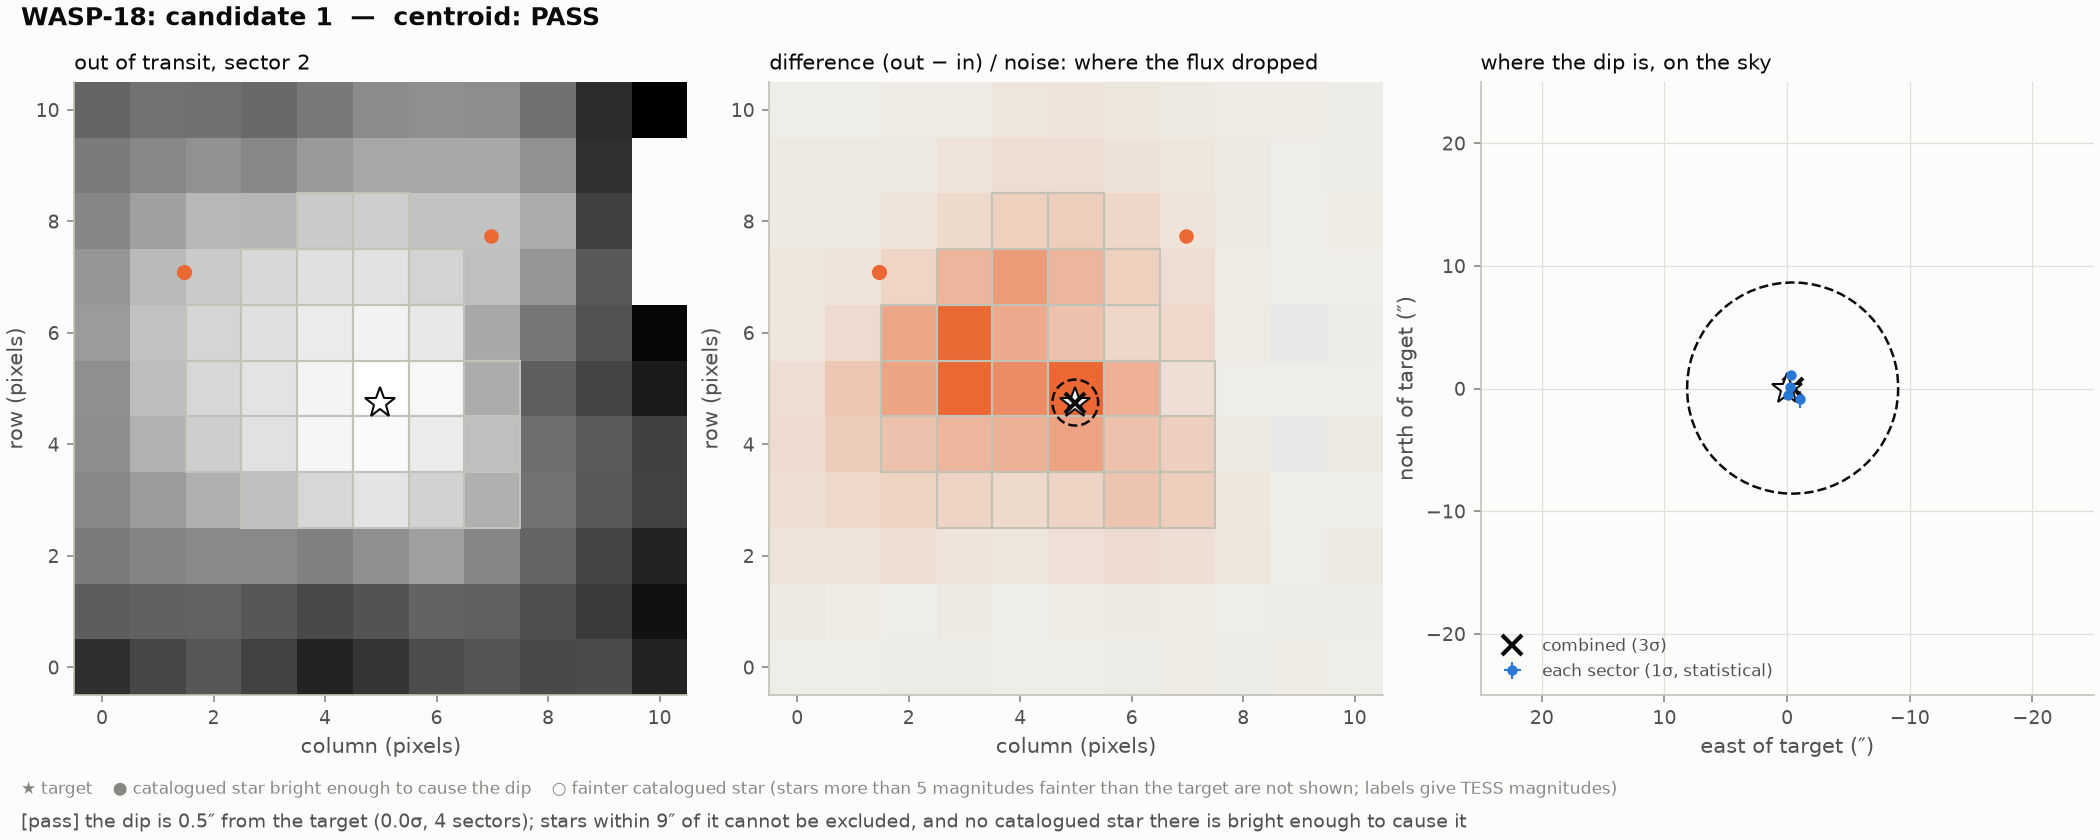
A TESS pixel is 21″ across and the photometric aperture spans several of them, so the light of neighboring stars falls into it too. An eclipsing binary among them dims the aperture a little, and in the light curve that can look exactly like a planet on the target. The target-pixel file, a stamp of about 11 × 11 pixels around the star at every 2-minute cadence, shows where the light went missing.
For every transit with data inside it and on both sides, the difference image is each pixel’s median on the flanks (0.75–2 durations from mid-transit) minus its median in the central 70 % of the transit: it is bright where the flux dropped. The difference images of a sector are averaged, and a model of the TESS pixel response function (the image a point source leaves on the detector, from the mission’s calibration files) plus a constant is fitted to the average within 4 pixels of the target. The fit starts from the target, from the most significant pixel and from every cataloged star bright enough to cause the dip, and the best fit wins: its position is where the dip is. The noise of each pixel is its cadence-to-cadence scatter carried through the medians, scaled by one factor measured on the transits’ own scatter (or, with fewer than four transits, on difference images made at other phases); the position’s uncertainty is the larger of the fit’s and the spread from resampling the transits.
Each sector’s position becomes an offset \(\Delta\) (east, north) from the target’s catalog position, moved to the date of the observations with the star’s proper motion. The sectors are averaged, each weighted by its covariance \(C_i\), and a systematic floor \(f = 2.5''\) (about an eighth of a pixel, for the imperfect PRF model and stamp astrometry) is added to the covariance of the average:
\[d^2 = \Delta^{\mathsf{T}}\left(C + f^2 I\right)^{-1}\Delta, \qquad \text{significance} \ge 3\sigma \;\Rightarrow\; \text{fail}\]The significance is the Gaussian equivalent of the tail probability of \(d^2\), a chi-square with two degrees of freedom. A failure names the cataloged (TIC) star at the dip’s position if one is bright enough to cause the dip even when totally eclipsed. A pass only means that the dip is consistent with the target: the message says within how many arcseconds, and lists the cataloged stars inside that radius that could still cause it. The test uses up to four sectors, those with the most in-transit data, and only the transits the other tests use. If it cannot run (no target pixels, or a dip too shallow to see in them, S/N below 4), that is a caveat like any other test that could not run. Simulated light curves have no pixels, so the test is not run on them at all.
Rotation period
A Lomb–Scargle periodogram of the un-detrended light curve (30-minute bins, transits masked) finds the star’s rotation period if a sinusoid explains at least 10 % of the variance. A candidate within 5 % of half, once or twice that period gets a warning. Leftover spot modulation concentrates false alarms there (see false alarms), though planets can orbit there too.
Verdicts
| outcome | verdict |
|---|---|
| any test fails | likely false positive |
| warnings, or a test that could not run | planet candidate (with caveats) |
| every test ran and passed | planet candidate (passes all tests) |
A test that cannot run, such as the density and radius tests for a star without a catalog radius, is a gap in the evidence, not a pass, so it earns the “caveats” verdict and is named in the reasons. The rotation test is the exception: when the star shows no rotational modulation, there is no rotation period for a signal to coincide with, and that is itself the answer.
A planet and an impostor, side by side
| test | SYN-3 c (planet) | SYN-5 (eclipsing binary) |
|---|---|---|
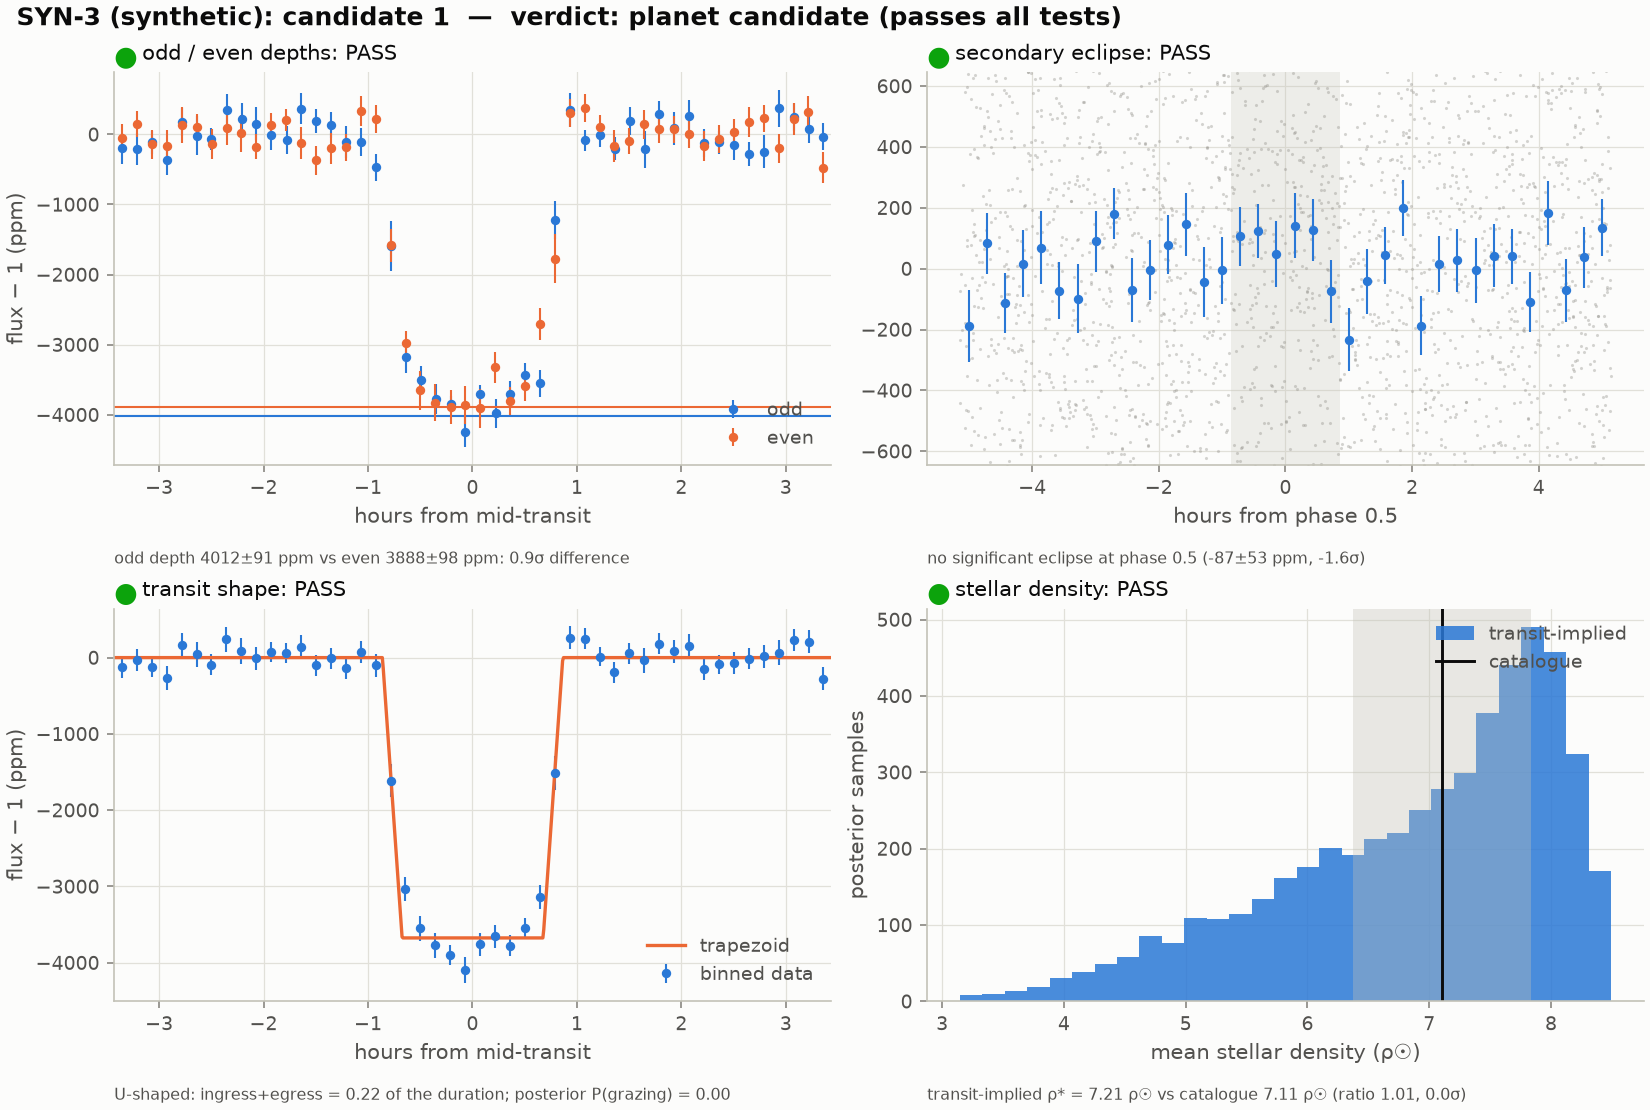
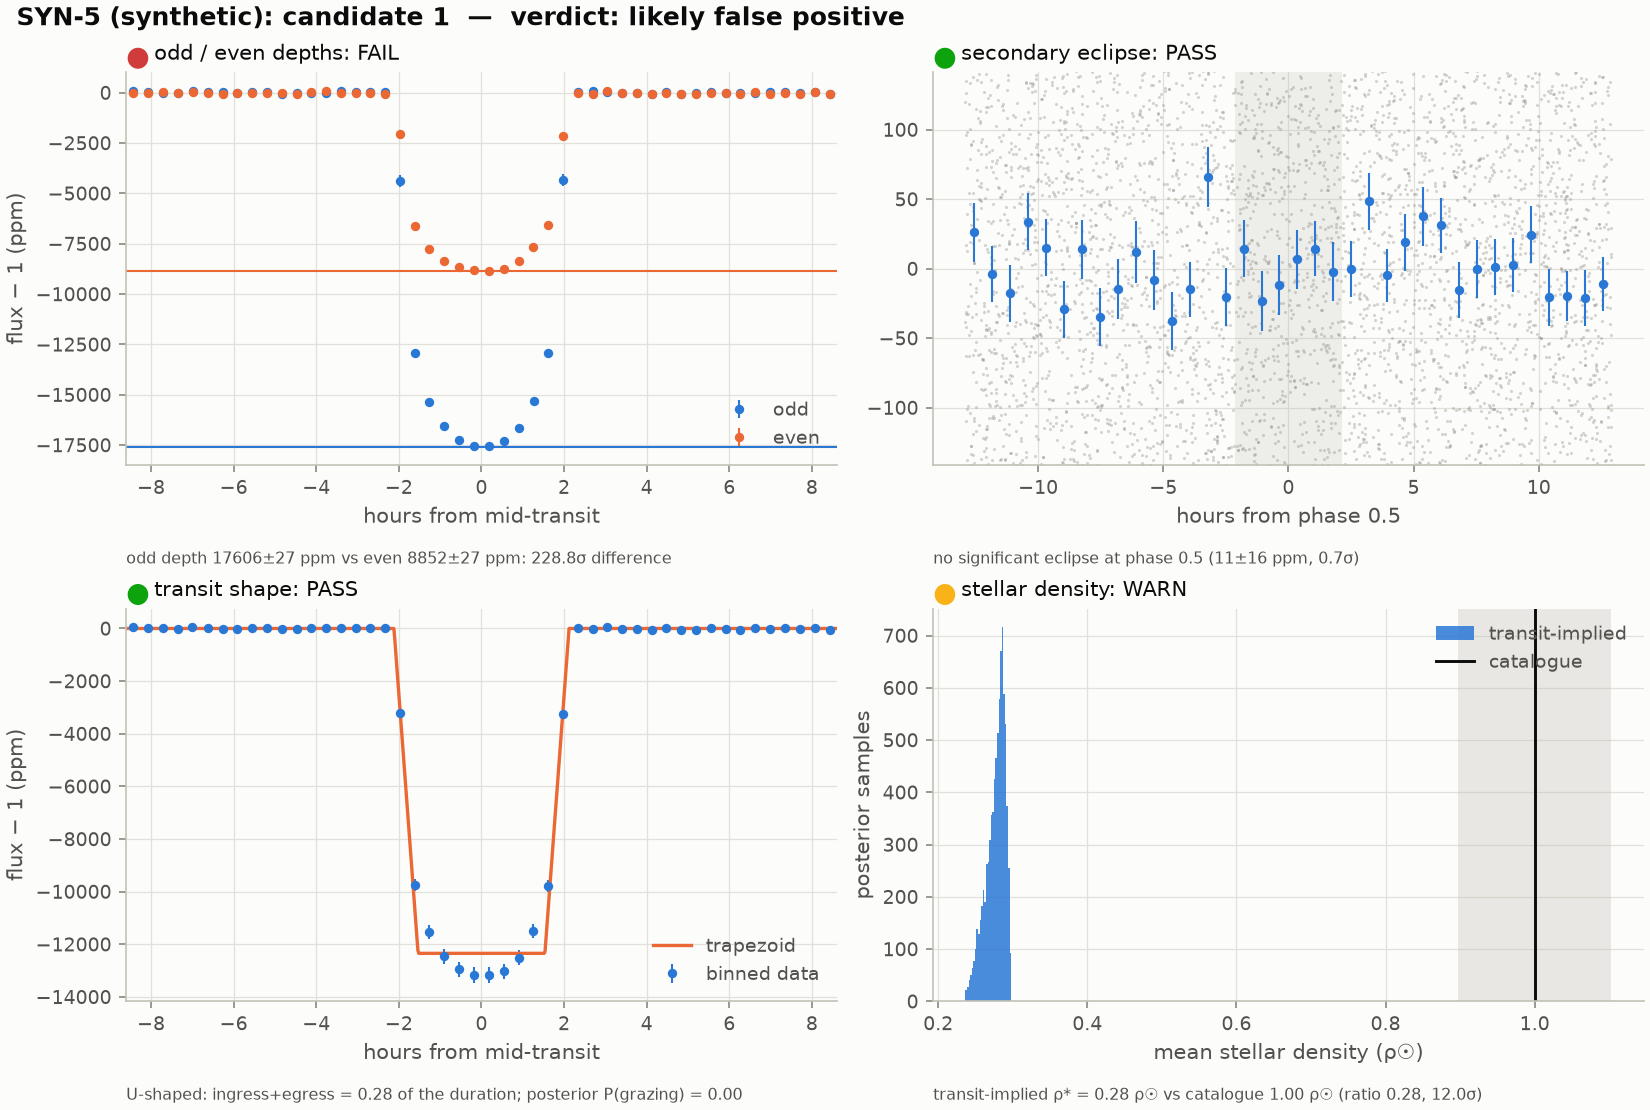
| odd/even | pass 4012 ± 91 vs 3888 ± 98 ppm, 0.9σ | fail 17606 ± 27 vs 8852 ± 27 ppm, 229σ |
| secondary | pass −87 ± 53 ppm | pass 11 ± 16 ppm |
| shape | pass ingress+egress 0.22 of T14 | pass 0.28 of T14 |
| density | pass 7.21 vs 7.11 ρ☉ (0.0σ) | warn 0.28 vs 1.00 ρ☉ (12σ) |
| radius | pass 0.21 RJ | pass 1.01 RJ |
| coverage | pass 13 of 13 transits fully covered | pass 20 of 20 |
| rotation | pass | pass |
Values from results/synthetic_benchmark/SYN-3/summary.md and SYN-5/summary.md (simulated
light curves have no pixels, so the centroid test does not run). The binary passes five of
the seven light-curve tests, which is why a pipeline needs all of them. BLS found it at half its
period, so the “transits” alternate between the two stars’ eclipses, and the odd/even test
catches that at 229σ.
A real planet’s own eclipse: WASP-18 b
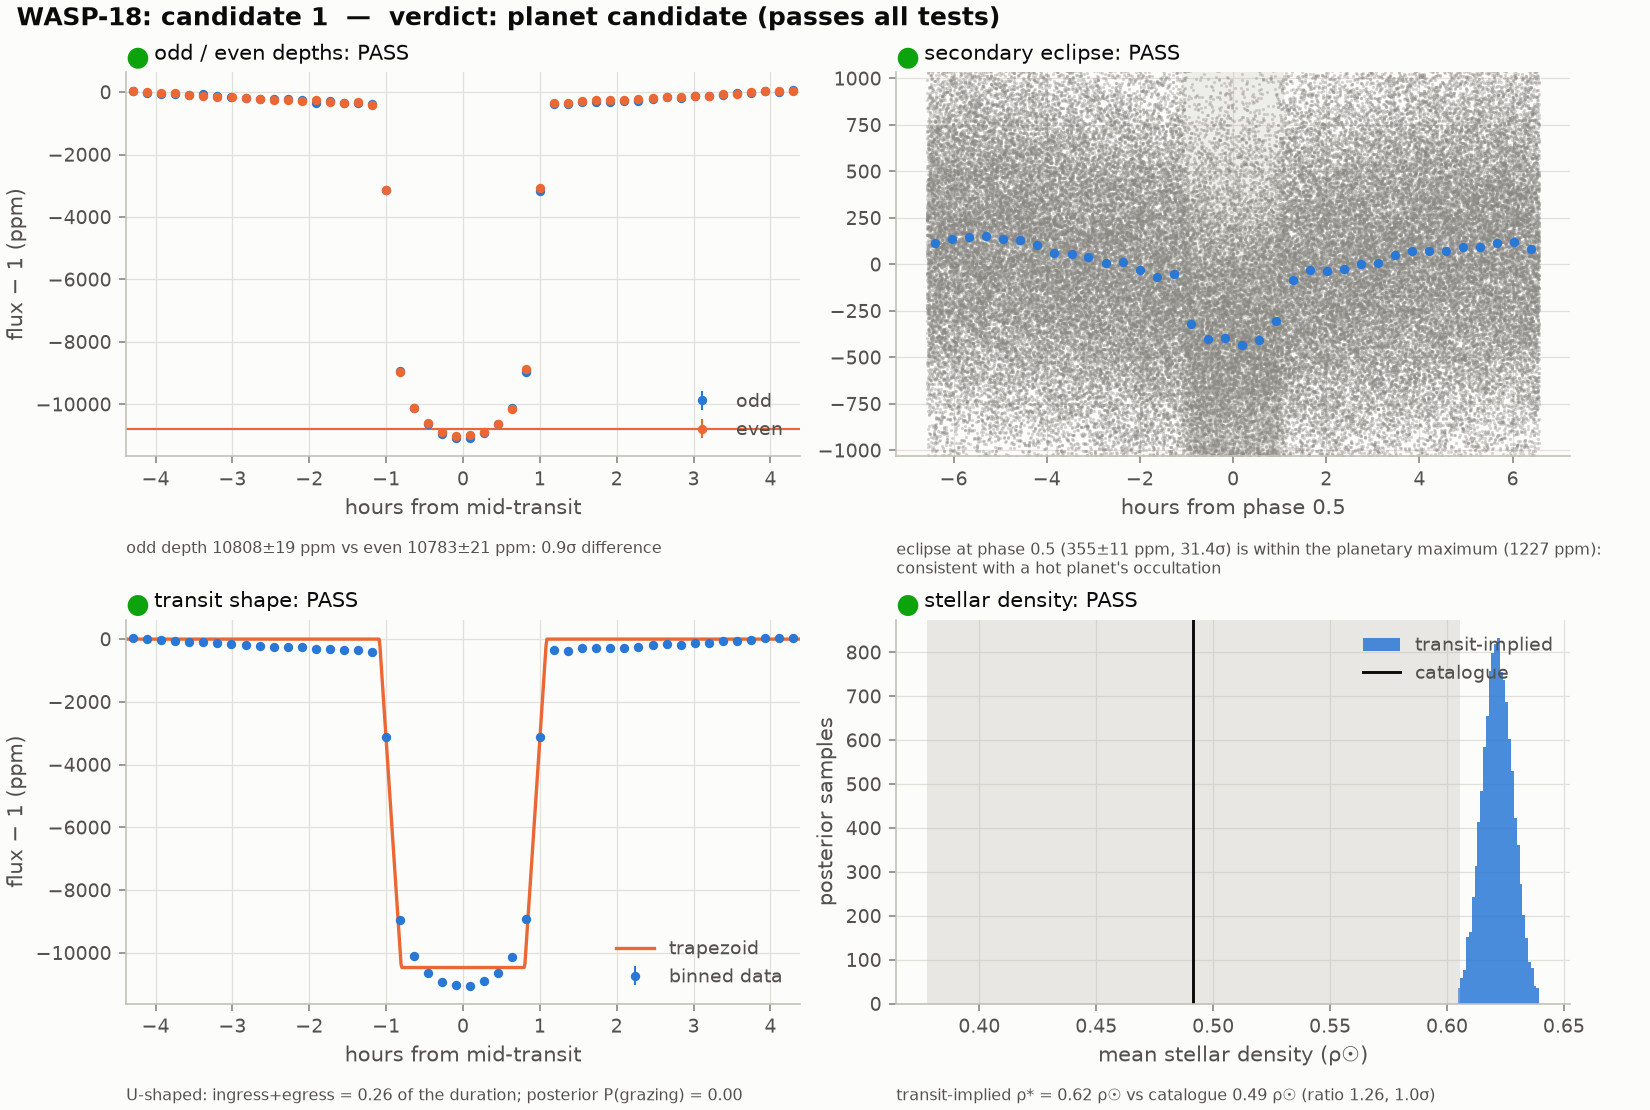
WASP-18 b is a hot Jupiter on a 0.94-day orbit, hot enough that its own dayside is visible
in the TESS band. The search found it twice: the transit, and a second signal at the same
period half an orbit later, 355 ± 11 ppm deep (31.4σ). That is far below the deepest
occultation such a planet could produce, 1,227 ppm by the formula above, so the pipeline
reports it as the planet’s occultation rather than a binary’s eclipse. The odd and even
transits agree (10,808 ± 19 against 10,783 ± 21 ppm, 0.9σ). With more than 200 transits the
uncertainties are tiny: the first run, which measured every transit against one flux level
for the whole light curve, found a 0.6 % difference at 2.9σ, just under the threshold.
Measuring each transit against the flux around it removed it. One transit, with data on one
side only and 8,079 ppm deep against a median of 10,558 ppm, was left out before the fit.
Values from results/validation/WASP-18/summary.md.
A real impostor: the binary in L 98-59’s light curve
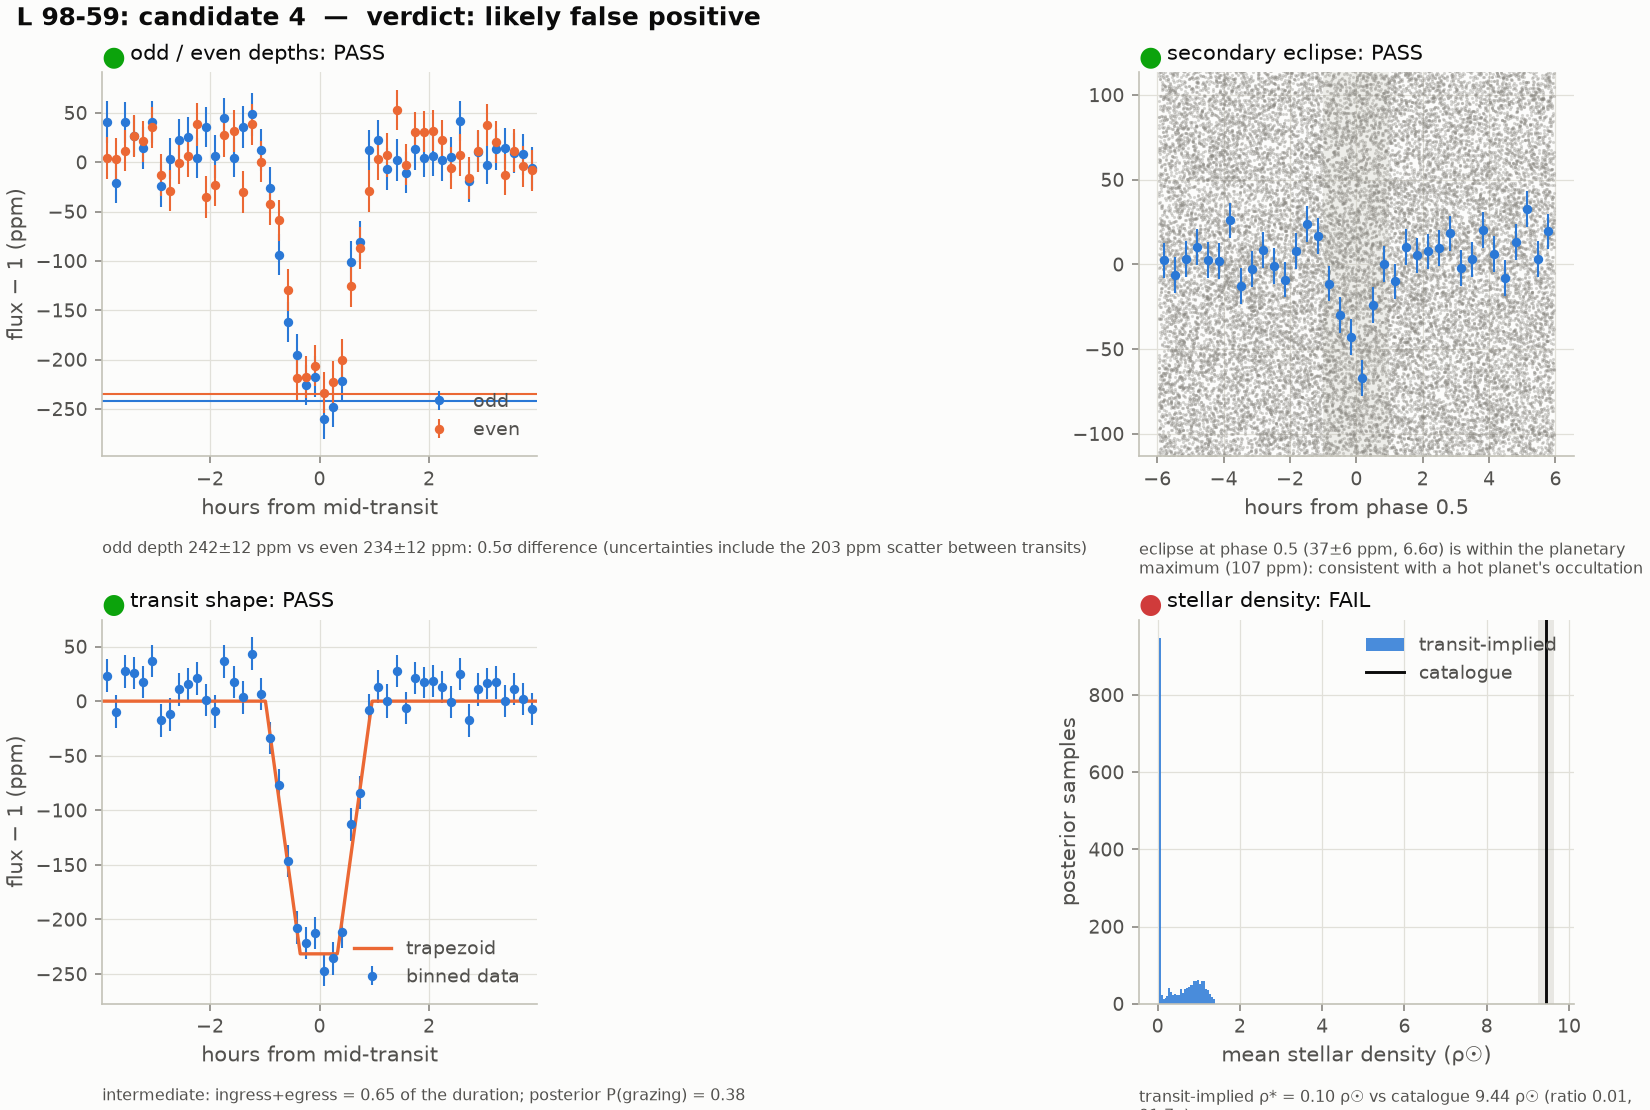
L 98-59 is a red dwarf with three known transiting planets, and the search finds all three. It then finds a fourth signal, at 1.049 days (S/N 36.8), which is not among the star’s TOIs. At phase 0.5 there is a 37 ± 6 ppm eclipse (6.6σ), and the transit shape implies a host star of 0.1 ρ☉ (68 % of the posterior between 0.04 and 1.0 ρ☉), against 9.44 ρ☉ in the catalog for L 98-59. Both point to an eclipsing binary rather than a planet, on a star whose light spills into L 98-59’s aperture, and the centroid test finds which. In each of four sectors the flux dropped 40–45″ south and 17–19″ east of L 98-59, the sectors agreeing to within 6″, and together they put the dip 46″ from the target (18.2σ) and 0.8″ from TIC 307210845, a star of magnitude 16.2, about 500 times fainter than L 98-59. To make the signal, its eclipses must remove at least a tenth of its light, and more since only part of it falls in the aperture: deep, but well within what an eclipsing binary does.
How the vetting reaches that verdict is a lesson in itself. The fit of this shallow signal
does not converge, and it wanders between a non-grazing solution and a grazing one. The
grazing solution has a larger companion on a tighter orbit, which lifts the deepest
occultation a planet could produce from 9 ppm (in the first run, whose fit stayed
non-grazing) to 107 ppm in the latest. The eclipse is then no longer too deep for a planet,
and the secondary-eclipse test passes it. The two solutions also give the density posterior
two modes. The density test as first written divided the difference of the log densities by
half the 16–84 % range of the posterior, a range that spanned both modes, and so it passed
a catalog density that no sample came within a factor of 6 of. It now uses the
posterior probability of reaching the catalog value, and the signal fails it at 92σ.
A number that large means only that nothing comes close: beyond a few standard
deviations it is set by the catalog’s quoted uncertainty (2 % here) and by the finite
number of posterior samples, and all that matters is that it exceeds 3. The centroid test
does not read the fit at all, and fails the signal on its own. Values from
results/validation/L_98-59/summary.md.
A blend caught in the pixels: TOI-600.01
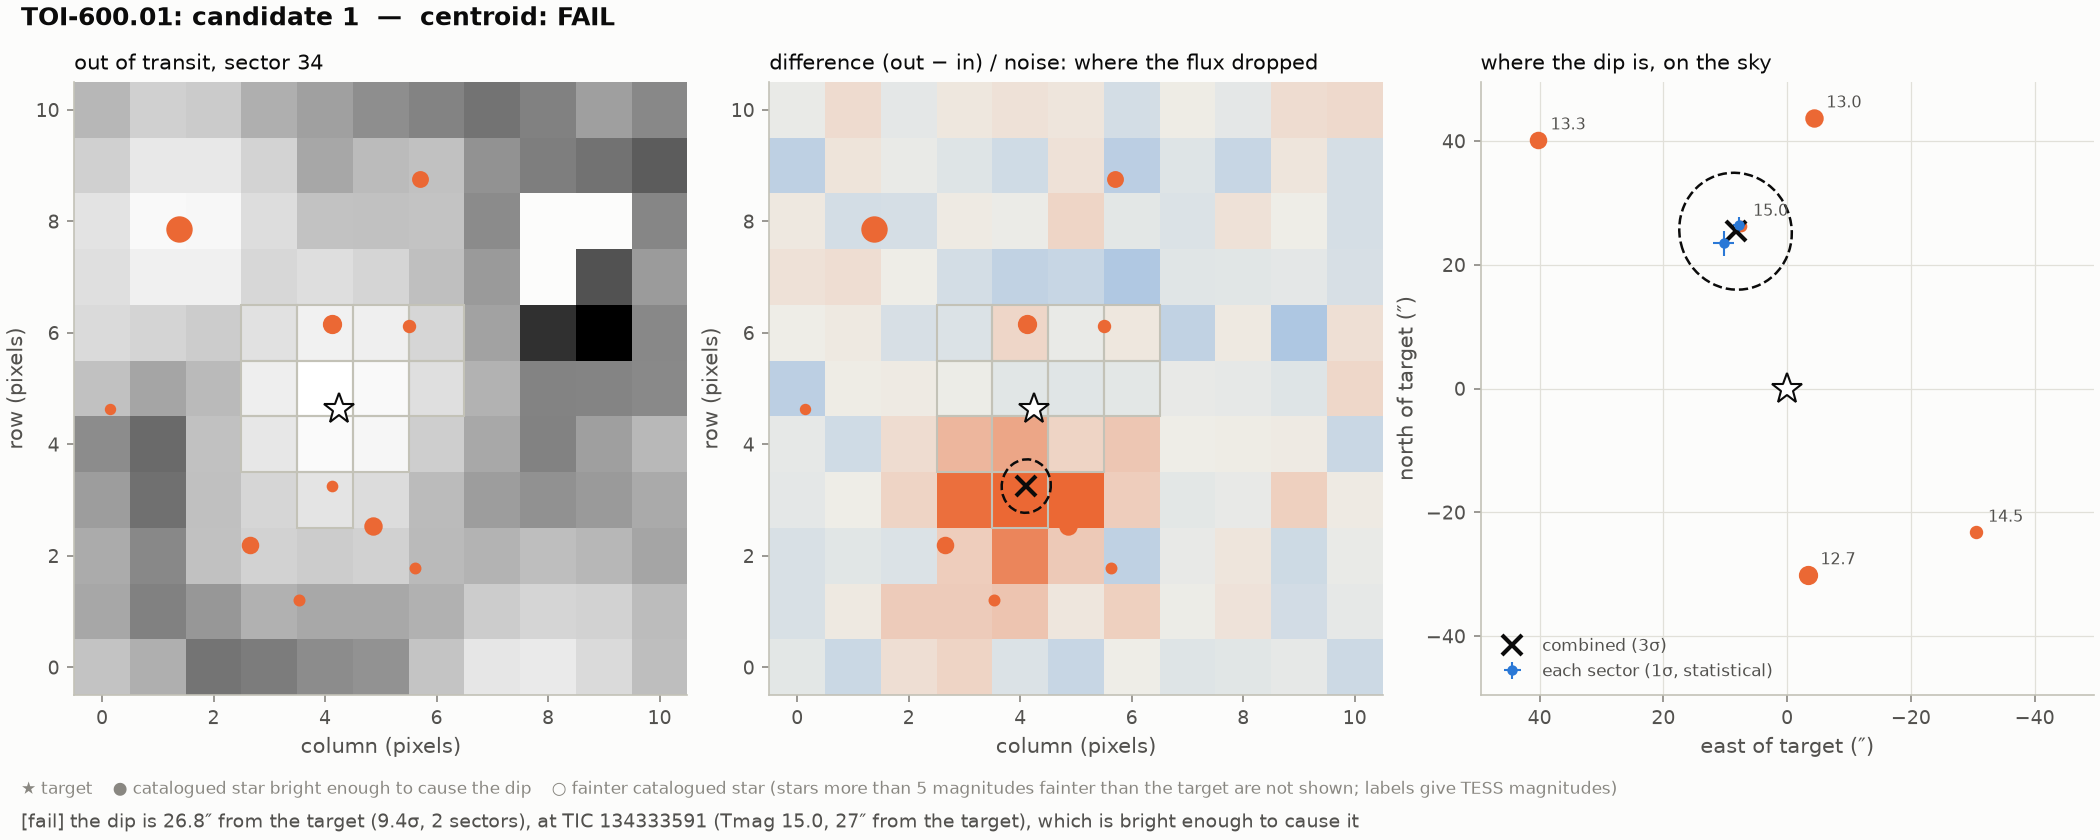
TOI-600.01 is a 4.37-day signal on a star of TESS magnitude 10.3 that the TESS Follow-up Observing Program Working Group has classified as a false positive, and its light curve gives little away. The odd and even transits agree (934 ± 110 against 828 ± 121 ppm), there is no eclipse at phase 0.5, and all 11 transits are covered on both sides. The TIC lists no radius for the star, so neither the density nor the radius test can run, and the only hint against a planet is a V-shaped transit (ingress and egress take 0.82 of the duration), which earns a warning. Without the pixels, the verdict would be a planet candidate with caveats.
The pixels settle it. In both sectors the flux dropped 23–26″ north and 8–10″ east of the
target, and the two sectors agree to within 4″. Together they put the dip 26.8″ from the
target (9.4σ) and 1.2″ from TIC 134333591, a star about 80 times fainter than the target.
Eclipses that remove about a tenth of its light, or somewhat more for the part of it that
falls outside the aperture, make the whole dip: most likely it is an eclipsing binary.
Values from results/toi_calibration/TOI-600_01/summary.md.
What the vetting cannot do The centroid test finds a blended binary only when it is far enough from the target: with 21″ pixels, even at best it cannot tell apart positions less than about 9″ apart (3σ), and for a shallow dip or a single sector the limit is wider (each result states its own). A binary closer than that, or one bound to the target, still looks like a planet on the target, and only follow-up observations can tell: high-resolution imaging and spectroscopy, the steps after a community TOI. “Passes all tests” means consistent with a planet on the target, not confirmed.