All tables on this page are
generated by scripts/update_docs.py from files in results/, which the scripts named
in each section write.
Confirmed TESS planets
Recovered versus published period, depth, and radius for confirmed planets that span
short and long periods and large and small sizes. The hosts are WASP-18 (sub-day hot
Jupiter), pi Men (small planet, very bright G dwarf), TOI-270 and L 98-59 (compact M-dwarf
systems, including planets smaller than Earth), and HD 21749 (long-period sub-Neptune).
Reference values are queried from the NASA Exoplanet Archive (pscomppars) at run time.
The recovered values are MCMC posterior medians from the full pipeline.
| planet | P published (d) | P recovered (d) | ΔP | depth published (ppm) | depth recovered (ppm) | Δdepth | Rp published (R⊕) | Rp recovered (R⊕) | ΔRp |
|---|---|---|---|---|---|---|---|---|---|
| WASP-18 b | 0.941452 | 0.941452 ± 9.9e-09 | +0.0000% | 10363 | 9816 ± 26 | -5.3% | 13.90 ± 0.89 | 14.54 ± 0.75 | +4.6% |
| pi Men c | 6.267840 | 6.267822 ± 1e-06 | -0.0003% | 251 | 274 ± 7.9 | +9.3% | 2.02 ± 0.046 | 2.08 ± 0.085 | +3.2% |
| TOI-270 b | 3.359920 | 3.360163 ± 9.2e-07 | +0.0072% | 942 | 1015 ± 61 | +7.7% | 1.28 ± 0.045 | 1.30 ± 0.056 | +1.6% |
| TOI-270 c | 5.660510 | 5.660478 ± 1.2e-06 | -0.0006% | 3136 | 3881 ± 5.3e+02 | +23.8% | 2.33 ± 0.01 | 2.54 ± 0.19 | +8.8% |
| TOI-270 d | 11.381940 | 11.379700 ± 4.5e-06 | -0.0197% | 2411 | 3483 ± 2e+02 | +44.5% | 2.00 ± 0.05 | 2.41 ± 0.1 | +20.6% |
| L 98-59 b | 2.253114 | 2.253114 ± 3.4e-07 | +0.0000% | 666 | 627 ± 26 | -5.8% | 0.84 ± 0.019 | 0.86 ± 0.032 | +2.7% |
| L 98-59 c | 3.690676 | 3.690675 ± 4e-07 | -0.0000% | 1568 | 1593 ± 1.2e+02 | +1.6% | 1.33 ± 0.029 | 1.37 ± 0.064 | +2.9% |
| L 98-59 d | 7.450729 | 7.450729 ± 1.4e-06 | +0.0000% | 2116 | 2008 ± 2.5e+02 | -5.1% | 1.63 ± 0.041 | 1.53 ± 0.11 | -5.7% |
| HD 21749 c | 7.789930 | 7.789772 ± 1.2e-05 | -0.0020% | 143 | 158 ± 39 | +10.6% | 0.89 ± 0.061 | 0.98 ± 0.15 | +9.7% |
| GJ 143 b | 35.612530 | 35.613439 ± 1.6e-05 | +0.0026% | 1225 | 1281 ± 94 | +4.6% | 2.61 ± 0.17 | 2.76 ± 0.27 | +5.8% |
Depth is the geometric depth (Rp/R*)² unless noted; Δ = 100 × (recovered − published) / published.
| host | sectors | signal | P (d) | S/N | known as | vetting verdict | failed tests / warnings |
|---|---|---|---|---|---|---|---|
| WASP-18 | 10 | 1 | 0.94145 | 787.8 | WASP-18 b | planet candidate (passes all tests) | – |
| WASP-18 | 10 | 2 | 0.94145 | 38.9 | – | occultation of signal 1 (phase 0.50), consistent with a planet | – |
| pi Men | 24 | 1 | 6.26781 | 106.5 | pi Men c | planet candidate (passes all tests) | – |
| TOI-270 | 7 | 1 | 5.66048 | 89.4 | TOI-270 c | planet candidate (with caveats) | warnings: density, rotation |
| TOI-270 | 7 | 2 | 11.37971 | 55.3 | TOI-270 d | likely false positive | failed: density; warnings: rotation |
| TOI-270 | 7 | 3 | 3.36016 | 31.3 | TOI-270 b | planet candidate (passes all tests) | – |
| TOI-270 | 7 | 4 | 46.66587 | 9.3 | no confirmed planet or TOI | likely false positive | failed: coverage |
| TOI-270 | 7 | 5 | 88.83541 | 8.2 | no confirmed planet or TOI | likely false positive | failed: odd_even, density; warnings: shape, coverage |
| L 98-59 | 27 | 1 | 3.69068 | 131.5 | L 98-59 c | planet candidate (passes all tests) | – |
| L 98-59 | 27 | 2 | 7.45073 | 64.8 | L 98-59 d | planet candidate (passes all tests) | – |
| L 98-59 | 27 | 3 | 2.25312 | 62.5 | L 98-59 b | planet candidate (passes all tests) | – |
| L 98-59 | 27 | 4 | 1.04918 | 36.8 | no confirmed planet or TOI | likely false positive | failed: density, centroid |
| L 98-59 | 27 | 5 | 0.52460 | 9.4 | – | occultation of signal 4 (phase 0.50), consistent with a planet | – |
| HD 21749 | 15 | 1 | 35.61342 | 65.8 | GJ 143 b | planet candidate (passes all tests) | – |
| HD 21749 | 15 | 2 | 7.78981 | 19.9 | HD 21749 c | planet candidate (with caveats) | – |
| HD 21749 | 15 | 3 | 145.68370 | 45.4 | no confirmed planet or TOI | likely false positive | failed: density, centroid; warnings: shape, coverage |
Known as: the confirmed planet (NASA Exoplanet Archive) or, failing that, the TOI and its TFOPWG disposition with the same period to within 1 %.
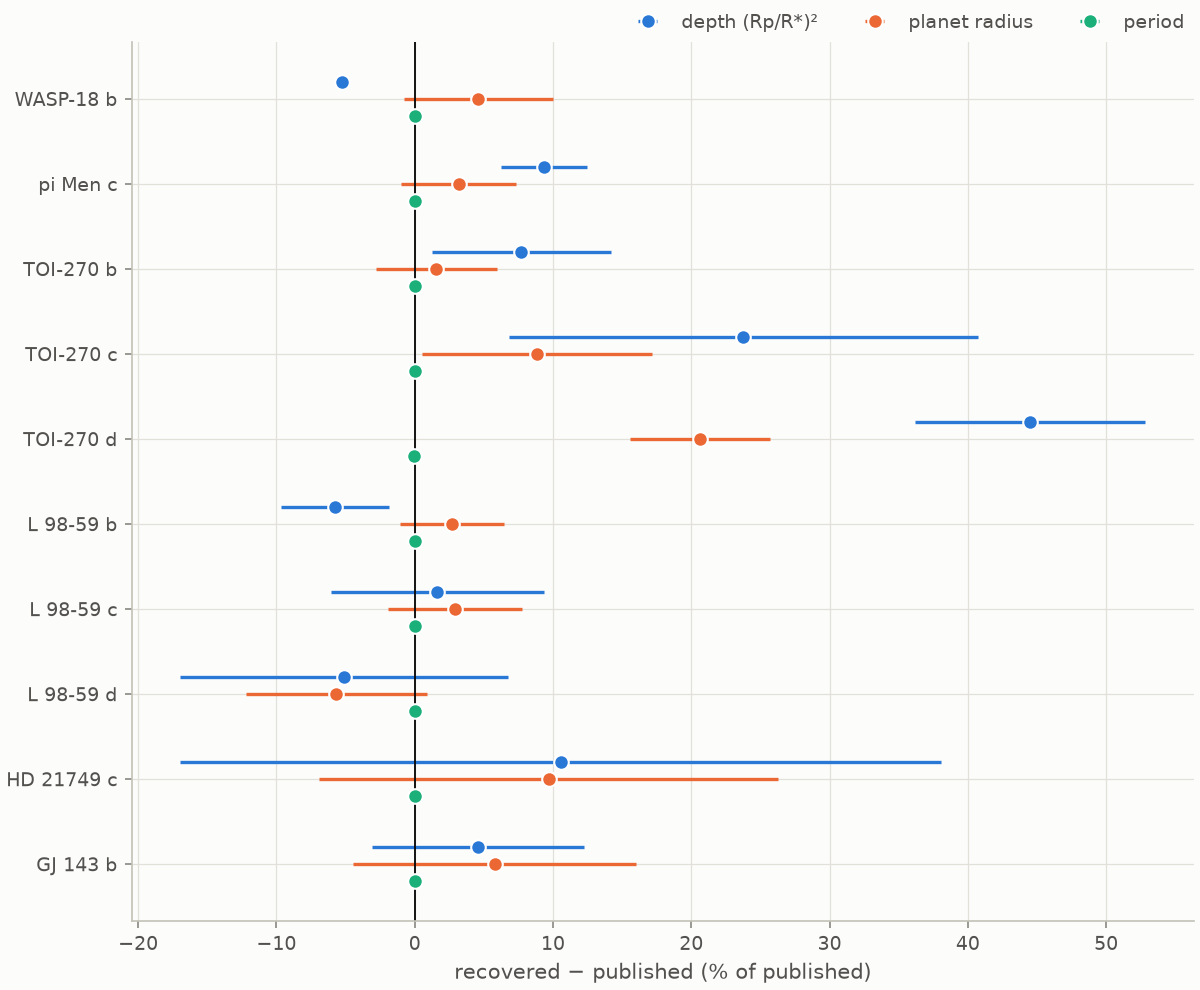
The search missed none of the confirmed planets (scripts/check_missed_planets.py).
How to read the comparison:
- Depth is compared as the geometric depth (Rp/R*)², the one definition shared by the fit and the archive. The observed depth of a limb-darkened transit is larger at mid-transit and smaller on average.
- Planet radius uses the TIC stellar radius, which can differ from the stellar radius adopted in the discovery paper. The fitted radius ratio isolates the part of any difference that comes from the light curve.
- Names are the archive’s. It lists HD 21749 as GJ 143, so its outer planet appears as GJ 143 b, and pi Men as HD 39091.
What the real data showed
The search found all 10 transiting planets that the archive lists for these five
stars, in 7 to 27 sectors of TESS data per star. For eight of the ten the fitted radius
ratio is within 6 % of the published one (median difference 3.4 %, from validation.json).
The exceptions are TOI-270 c (11 %) and d (20 %), discussed below. Periods agree within
2.5 of the archive’s standard deviations, except for TOI-270 b and d, whose archive periods
differ from the fitted ones by 4.9 and 20 standard deviations. The TOI catalog’s current
ephemerides for the same two planets (TOI-270.03 and .02) agree with the fitted periods to
within 5 × 10⁻⁶ days, so the difference lies in the archive’s adopted values, not in the
fit.
Seven planets pass every vetting test, among them L 98-59 b, smaller than Earth (0.86 R⊕ fitted, 0.84 R⊕ published). The centroid test puts nine of the ten dips on their star, none more than 0.9σ away, though for pi Men c, whose star saturates the detector, it cannot rule out anything within 87″. The tenth, HD 21749 c (0.98 R⊕ fitted, 0.89 R⊕ published), is too shallow to see in the target pixels (S/N 2.3), so the centroid test cannot run and the planet gets a caveat. The rest are the most instructive:
- HD 21749 c is found, and b passes. In the first run on the same data, c was missed although it is there at S/N 16.6: a few deep, isolated dips at the edges of data segments add power at every trial period of a box search, and the third pass peaked at 139 days with SDE 5.9, below the threshold of 7, so the search stopped. The search now masks such dips before each pass and measures each peak only against trial periods that can hold two transits, and c comes out in the second pass (7.790 days, SDE 7.8, S/N 19.9). In the first run, b failed the odd/even test at 9.4σ because of a single transit on an instrumental ramp. That transit, 2,574 ppm deep against a median of 1,444 ppm, with the flux 1,722 ppm higher before it than after it, is now left out before the fit, and the odd and even depths agree (0.3σ). Two transits of c are left out the same way.
- TOI-270 d is labeled a likely false positive by the density test. The fit prefers a high impact parameter, b = 0.87 (+0.023/−0.031), with a/R* = 21.5 and a duration of 2.46 h. That implies a star of 1.03 ρ☉, against 6.91 ρ☉ in the TIC. The archive’s solution has b = 0.23, a/R* = 41.7 and a duration of 2.12 h, consistent with the star. No single transit stands out in depth. Its simulated twin, SYN-3 d, whose transits are strictly periodic, passes.
- TOI-270 c gets two warnings. Its fit also prefers a high impact parameter, b = 0.75 (+0.08/−0.18), and a duration of 1.92 h, against b = 0.35 and 1.68 h in the archive. The implied star, 2.08 ρ☉, is 3.3σ from the TIC’s 6.91 ρ☉, though within the factor of 5 that fails a signal. In the previous run, which masked a partly covered transit of c as an instrumental dip, the difference was 2.8σ, just short of a warning. The second warning is for rotation: the strongest periodicity of TOI-270’s un-detrended light curve, 11.39 days (279 ppm), is within 0.6 % of twice c’s period and within 0.1 % of d’s. The pipeline takes it for the star’s rotation. A rotation period equal to a planet’s orbital period would be a coincidence, and the pipeline cannot tell what causes this periodicity.
The transit times of both planets shift between observing seasons, in opposite directions,
as expected for two planets near a 2:1 period ratio that pull on each other: medians of
−6.6, +11.1 and −1.9 minutes for c, and +5.5, −7.6 and +3.8 minutes for d
(TOI-270/timing_1.md and timing_2.md). A fold on a single period smears such transits.
Both fitted durations exceed the archive’s by about the spread of the transit times (by 14
and 21 minutes, against spreads of 22 and 17 minutes), which suggests that the fits match
smeared transits with longer, more grazing ones. The pipeline does not fit transit times
one by one, so this is not established.
The search also found four signals that match no known planet or TOI, and the vetting rejects all four:
- in TOI-270, a 46.67-day signal whose three events all sit at the edges of data segments (coverage test), and an 88.84-day signal whose odd and even events differ by 4.4σ and imply a star a seventh as dense as TOI-270 (odd/even and density tests);
- a 1.049-day signal in L 98-59 with a 37 ppm eclipse at phase 0.5 and a transit shape that implies a star far less dense than L 98-59 (0.1 against 9.4 ρ☉): an eclipsing binary, which the centroid test places 46″ from L 98-59 (18.2σ), on TIC 307210845, a star of magnitude 16.2 (see the vetting page);
- in HD 21749, a 145.7-day signal resting on two deep, hours-long dips, only one of them covered by data on both sides, whose shape implies a star about 70 times less dense than HD 21749 (density test), and which the centroid test places 18″ from the target (5.8σ, one sector), where no cataloged star is bright enough to cause it.
WASP-18 b’s occultation, 355 ± 11 ppm deep, is found as a second signal and is recognized
as planetary, not as a binary’s eclipse (see the
vetting page). All numbers are from
the report folders in results/validation/.
Lessons from the real data
- Archive names. The NASA Exoplanet Archive lists pi Men as HD 39091 and HD 21749 as
GJ 143, so a query by the common name found no planets for them. Stars are now matched
by TIC ID (test:
test_confirmed_planets_are_matched_by_tic_id). - Events at the edges of data segments. In the first real-data run, TOI-270’s 56.37-day
signal passed every test except for a shape warning. Both of its events sit next to
gaps, where the spacecraft’s systematics are strongest. The coverage test was added in
response, and it also rejects HD 21749’s 193-day signal (test:
test_coverage_test_fails_signals_made_of_edge_events). - One bad transit is enough. The vetting tests compare averages, and in the first run
a single transit on an instrumental ramp moved HD 21749 b’s odd-transit average by far
more than its uncertainty. Every transit’s depth is now measured on its own, and one
far from the others is left out before the fit and the tests, as long as such outliers
are rare (tests:
test_bad_transits_flags_a_single_transit_on_a_ramp,test_bad_transits_leaves_an_eclipsing_binary_alone,test_pipeline_drops_a_bad_transit_before_fitting_and_vetting). - Deep isolated dips hide shallow planets. The synthetic light curves have no such
dips, so the synthetic completeness did not capture this failure: HD 21749 c was in the
data at S/N 16.6 and was not found. Dips that the data do not cover on both sides and
that lie next to a gap of more than half a day are now masked before each pass, and the
SDE is measured only against trial periods that can hold two transits (tests:
test_dips_at_segment_edges_no_longer_hide_a_shallow_planet,test_eligible_trials_need_two_transits_with_data). The mask has a cost: a real transit cut by such a gap is masked too (Completeness). A first version masked uncovered dips wherever they fell, and 17 of the 22 it removed away from long gaps in these five stars were transits of the known planets, cut by short gaps (tests:test_a_transit_cut_by_a_short_gap_is_not_an_edge_event,test_a_two_transit_planet_is_found_when_one_transit_is_cut_by_a_short_gap). - Real planets can fail the density test. The factor-of-5 limit was chosen to allow for eccentric orbits, and TOI-270 d exceeds it, probably because timing variations smear its folded transit (above). Checked against TOIs the follow-up team has resolved, the test rejected no confirmed planet (below), so the limit stays.
- A test is only as good as the posterior it reads. In the first run, the vetting
rejected L 98-59’s 1.049-day binary with both the secondary-eclipse and the density
tests. On the final code its fit, which does not converge, wandered into a grazing
solution. That raised the largest occultation a planet could produce from 9 to 24 ppm,
and gave the density posterior a second mode. The density test divided by half the
16–84 % range of the log density, which then spanned both modes, so a catalog density
that no posterior sample came within a factor of 6 of passed at 1.9σ. The test now uses
the posterior’s tail probability instead, and the binary fails it again (test:
test_density_mismatch_is_not_diluted_by_a_second_posterior_mode). The secondary-eclipse limit still moves with the fit: it is 107 ppm in the latest run.
Vetting checked against resolved TOIs
The vetting thresholds were set from physics and simulations. To see how its verdicts compare
with reality, scripts/calibrate_vetting_on_tois.py runs the full pipeline on TESS Objects
of Interest that the TESS Follow-up Observing Program Working Group (TFOPWG) has resolved:
confirmed or known planets (CP, KP) and false positives (FP). The selection uses the same cuts
as the candidate verdicts, in a random order within each class.
Selection: TFOPWG disposition CP or KP (planet) or FP (false positive); 1 d < P < 15 d; Tmag <= 11; depth >= 800 ppm; one TOI per star; SPOC 2-minute light curves under the TOI’s own TIC ID; random order within each class (seed 1); first 15 of each class; the first observing season of each star (its first sector with 2-minute data and those numbered up to 3 after it).
| TFOPWG class | TOIs | planet candidate (passes all tests) | planet candidate (with caveats) | likely false positive | not recovered by the search |
|---|---|---|---|---|---|
| planet | 15 | 11 | 2 | 0 | 2 |
| false positive | 15 | 2 | 2 | 8 | 3 |
Outcome of each vetting test for the recovered TOIs (fail / warn / pass / n/a):
| test | planet | false positive |
|---|---|---|
| odd_even | 0 / 0 / 13 / 0 | 1 / 0 / 11 / 0 |
| secondary | 0 / 0 / 13 / 0 | 0 / 0 / 12 / 0 |
| shape | 0 / 0 / 13 / 0 | 0 / 7 / 5 / 0 |
| density | 0 / 1 / 12 / 0 | 5 / 1 / 3 / 3 |
| radius | 0 / 0 / 13 / 0 | 3 / 0 / 7 / 2 |
| coverage | 0 / 0 / 13 / 0 | 1 / 0 / 11 / 0 |
| rotation | 0 / 1 / 4 / 8 | 0 / 0 / 5 / 7 |
| centroid | 0 / 0 / 13 / 0 | 5 / 0 / 7 / 0 |
The statistic each test’s thresholds apply to, for the recovered TOIs: median and range (number of TOIs).
| statistic | planet | false positive |
|---|---|---|
| odd/even difference (σ) | 0.46 (0.12 to 1.69; 13) | 0.69 (0.01 to 17.47; 12) |
| dip at phase 0.5 (σ) | 0.66 (-1.58 to 6.43; 13) | 0.25 (-1.79 to 1.24; 12) |
| ingress + egress / duration | 0.26 (0.08 to 0.65; 13) | 0.73 (0.10 to 0.90; 12) |
| posterior P(grazing) | 0.00 (0.00 to 0.02; 13) | 0.04 (0.00 to 0.97; 12) |
| transit-implied / catalog density | 1.08 (0.34 to 2.99; 13) | 1.63 (0.06 to 12.60; 9) |
| companion radius (R_J) | 1.26 (0.22 to 1.82; 13) | 1.44 (0.25 to 9.07; 10) |
| dip offset from the target (σ) | 0.26 (0.01 to 2.11; 13) | 1.97 (0.10 to 14.78; 12) |
| dip offset from the target (″) | 1.70 (0.31 to 8.75; 13) | 7.60 (1.03 to 37.50; 12) |
| TOI | TIC | TFOPWG | P (d) | depth (ppm) | sectors | found at | verdict | tests failed |
|---|---|---|---|---|---|---|---|---|
| TOI-834.01 | 404340025 | KP | 2.6756 | 14341 | 1 | 1 × P | planet candidate (passes all tests) | – |
| TOI-824.01 | 193641523 | CP | 1.3930 | 1576 | 2 | 1 × P | planet candidate (passes all tests) | – |
| TOI-125.01 | 52368076 | CP | 4.6517 | 978 | 2 | 1 × P | planet candidate (passes all tests) | – |
| TOI-1820.01 | 393831507 | CP | 4.8607 | 6140 | 1 | 1 × P | planet candidate (passes all tests) | – |
| TOI-2012.01 | 138294130 | KP | 3.0565 | 8800 | 1 | 1 × P | planet candidate (passes all tests) | – |
| TOI-2140.01 | 399860444 | KP | 2.4706 | 14311 | 1 | 1 × P | planet candidate (passes all tests) | – |
| TOI-264.01 | 122612091 | KP | 2.2167 | 4240 | 2 | 1 × P | planet candidate (with caveats) | – |
| TOI-1233.01 | 260647166 | CP | 14.1759 | 907 | 2 | – | not recovered by the search | – |
| TOI-1683.01 | 58542531 | CP | 3.0575 | 1118 | 1 | 1 × P | planet candidate (passes all tests) | – |
| TOI-4559.01 | 271169413 | CP | 3.9649 | 1161 | 1 | – | not recovered by the search | – |
| TOI-150.01 | 271893367 | CP | 5.8574 | 6490 | 4 | 1 × P | planet candidate (passes all tests) | – |
| TOI-1476.01 | 432549364 | KP | 1.2175 | 6969 | 1 | 1 × P | planet candidate (with caveats) | – |
| TOI-1151.01 | 69679391 | KP | 3.4741 | 15748 | 1 | 1 × P | planet candidate (passes all tests) | – |
| TOI-1410.01 | 199444169 | CP | 1.2169 | 1240 | 1 | 1 × P | planet candidate (passes all tests) | – |
| TOI-2154.01 | 428787891 | CP | 3.8241 | 10104 | 1 | 1 × P | planet candidate (passes all tests) | – |
| TOI-1369.01 | 155005217 | FP | 7.6047 | 1200 | 2 | 1 × P | likely false positive | odd_even |
| TOI-146.01 | 355636844 | FP | 6.3056 | 860 | 2 | – | not recovered by the search | – |
| TOI-1707.01 | 240148934 | FP | 2.0236 | 1710 | 3 | 1 × P | likely false positive | density, centroid |
| TOI-1401.01 | 259126549 | FP | 7.3845 | 25160 | 4 | 1 × P | planet candidate (with caveats) | – |
| TOI-1668.01 | 417705690 | FP | 2.3633 | 1121 | 1 | 1 × P | likely false positive | density, centroid |
| TOI-1108.01 | 295599256 | FP | 7.1440 | 11593 | 4 | 1 × P | likely false positive | density, radius |
| TOI-1309.01 | 287190564 | FP | 1.4986 | 2189 | 2 | 1 × P | likely false positive | density, radius, coverage, centroid |
| TOI-4420.01 | 362709886 | FP | 4.7259 | 6310 | 1 | 1 × P | planet candidate (with caveats) | – |
| TOI-981.01 | 127476180 | FP | 1.6038 | 1191 | 1 | – | not recovered by the search | – |
| TOI-619.01 | 267527924 | FP | 1.8080 | 1264 | 2 | 1 × P | likely false positive | centroid |
| TOI-592.01 | 196286587 | FP | 10.4138 | 1948 | 1 | 1 × P | planet candidate (passes all tests) | – |
| TOI-600.01 | 134396419 | FP | 4.3653 | 1362 | 2 | 1 × P | likely false positive | centroid |
| TOI-389.01 | 271900960 | FP | 13.4591 | 2579 | 4 | – | not recovered by the search | – |
| TOI-1157.01 | 147576037 | FP | 13.0727 | 4080 | 2 | 1 × P | likely false positive | density, radius |
| TOI-987.01 | 52548453 | FP | 5.2147 | 3754 | 1 | 1 × P | planet candidate (passes all tests) | – |
What the resolved TOIs showed
No real planet was rejected. The search found 13 of the 15 planets at their catalog period. Eleven pass every test and two get a caveat: TOI-264.01 a density warning (the transit implies 2.2 times the catalog density of 0.05 ρ☉, at 3.3σ) and TOI-1476.01 a rotation warning, because the strongest periodicity of its light curve is half the orbital period, plausibly the hot Jupiter’s own ellipsoidal variation rather than starspots. The centroid test puts all 13 dips on the target: the largest offset is 8.7″ (2.1σ, TOI-1683.01, one sector), and the limit is 3σ. The two planets that were missed show two limits of the search rather than of the vetting:
- TOI-1233.01 orbits HD 108236, a star with five transiting planets. In two sectors the
highest peaks of the periodogram belong to three of them, near 6.2, 14.2 (TOI-1233.01
itself) and 19.6 days (
TOI-1233_01/periodogram_1.png), and none reaches SDE 7. The strongest, 19.59 days, has S/N 18.4 but SDE 6.2, so the search stops: each planet’s peak is measured against a periodogram that also holds the others. - TOI-4559.01 has one sector in its first season. The search found it at the right period (3.96308 days) with SDE 7.4, but its S/N of 6.9 is just under the threshold of 7.
Two thirds of the detected false positives are caught. Twelve of the 15 were found, and eight are labeled likely false positives: TOI-1369.01 by the odd/even test (17σ, a binary found at half its period), five by the density test (transit-implied densities of 0.06 to 12.6 times the catalog value), three of those also by the radius test (4.2 to 9.1 R_J) and one also by the coverage test, and five by the centroid test. The centroid test finds the dip 11 to 37″ from the target (3.6 to 14.8σ), each time at a fainter cataloged star bright enough to cause it. Three of the five were also caught by the density test. The other two, TOI-619.01 and TOI-600.01, were caught by nothing else: before the centroid test they got through with a caveat for their V-shaped eclipses. TOI-600.01’s dip sits 27″ from the target, on TIC 134333591, a star of magnitude 15.0 (9.4σ; the figure is on the vetting page). Of the other four, two get a caveat: a density warning for TOI-4420.01, and for TOI-1401.01 a density test that could not run, because the TIC has no radius for its star (without the rule that such a test is a caveat, a 2.05 R_J companion would have passed everything). TOI-592.01 and TOI-987.01 pass all tests. Their dips are U-shaped (ingress and egress 0.17 and 0.27 of the duration), of planetary size (0.79 and 1.38 R_J), with transit-implied densities within the uncertainties of the catalog values (4.8 and 1.6 times them, at 1.7σ and 1.5σ) and no significant difference between odd and even transits. The centroid test puts TOI-987.01’s dip on the target (3.0″, 0.7σ); it cannot exclude stars within 9″ of the dip, but no cataloged star there is bright enough to cause it. TOI-592.01’s dip is 8.6″ from the target (1.8σ), and the test cannot exclude four cataloged stars that are bright enough to cause it, the brightest of magnitude 11.6 and 11″ from the target. Many TFOPWG false positives are eclipsing binaries on a neighboring star whose light is blended with the target’s. The centroid test catches them only when that star is far enough away: TESS’s pixels are 21″ across, and even at best the test cannot tell apart two positions less than about 9″ apart (3σ). Closer blends still look like planets here, and telling them apart takes follow-up observations.
The thresholds stay where they are. The table of statistics shows why. No planet came near a threshold that fails a signal: the largest odd/even difference was 1.7σ (the limit is 3σ), the density ratios ran from 0.34 to 2.99 (the limit is a factor of 5), the largest companion was 1.82 R_J (the limit is 2.5 R_J), and the largest dip offset was 2.1σ (the limit is 3σ). Loosening a threshold would therefore rescue no planet, since none failed. Tightening the odd/even, density or radius limit would catch no further false positive: the ones that got through are nowhere near them. The centroid limit is the exception: three false positives passed it at 1.7 to 2.1σ, but so did TOI-1683.01, a confirmed planet, at 2.1σ, so a lower limit would reject a planet too. With 13 planets and 12 false positives, moving a threshold to fit this sample would only fit its noise. The V-shape test stays a warning, although it flagged 7 of the 12 false positives and none of the planets, because grazing planets exist and none happened to be in this sample.
End-to-end benchmark on synthetic systems (truth known)
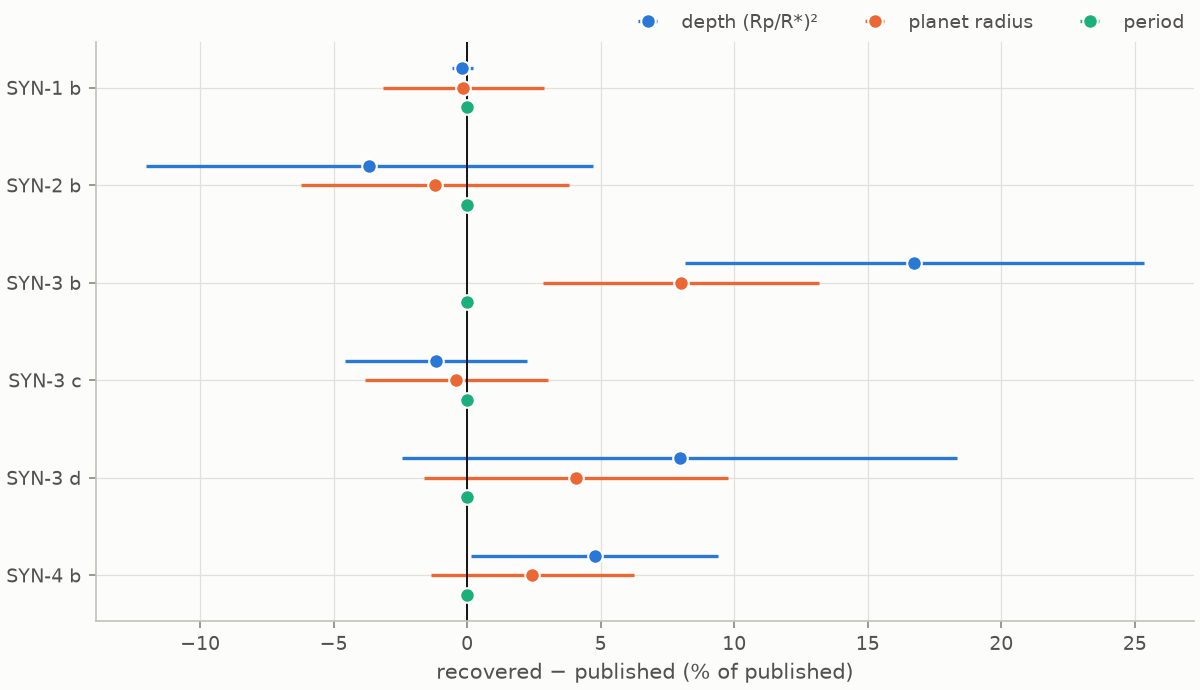
The same pipeline and comparison (scripts/run_synthetic_benchmark.py), run on simulated
TESS-like light curves whose planets are known exactly. The systems cover the same regimes
as the real sample: a hot Jupiter, a small planet around a bright star observed for six
sectors, a compact three-planet M-dwarf system, and a long-period planet. The fifth is an
eclipsing binary as a negative control; vetting must reject it. These are simulations,
not TESS data, and the “published” columns hold the injected (true) values. Host-star
parameters are given to the pipeline with 3 % (radius) and 5 % (mass) uncertainties.
| planet | P published (d) | P recovered (d) | ΔP | depth published (ppm) | depth recovered (ppm) | Δdepth | Rp published (R⊕) | Rp recovered (R⊕) | ΔRp |
|---|---|---|---|---|---|---|---|---|---|
| SYN-1 b | 0.940000 | 0.940000 ± 8.8e-07 | -0.0000% | 9091 | 9074 ± 36 | -0.2% | 13.00 | 12.98 ± 0.39 | -0.1% |
| SYN-2 b | 6.270000 | 6.270082 ± 5e-05 | +0.0013% | 278 | 268 ± 23 | -3.7% | 2.00 | 1.98 ± 0.1 | -1.2% |
| SYN-3 b | 3.360000 | 3.359982 ± 6.5e-05 | -0.0005% | 984 | 1148 ± 85 | +16.7% | 1.30 | 1.40 ± 0.067 | +8.0% |
| SYN-3 c | 5.660000 | 5.660025 ± 4.9e-05 | +0.0004% | 3353 | 3313 ± 1.1e+02 | -1.2% | 2.40 | 2.39 ± 0.082 | -0.4% |
| SYN-3 d | 11.380000 | 11.379804 ± 0.00022 | -0.0017% | 2567 | 2771 ± 2.7e+02 | +8.0% | 2.10 | 2.19 ± 0.12 | +4.1% |
| SYN-4 b | 35.600000 | 35.599620 ± 0.00021 | -0.0011% | 1345 | 1409 ± 62 | +4.8% | 2.80 | 2.87 ± 0.11 | +2.4% |
Depth is the geometric depth (Rp/R*)² unless noted; Δ = 100 × (recovered − published) / published.
| system | description | sectors | detections | vetting verdicts |
|---|---|---|---|---|
| SYN-1 | hot Jupiter on a sub-day orbit around an F star | 2 | 1 | planet candidate (passes all tests) |
| SYN-2 | small planet around a bright, quiet G dwarf observed for six sectors | 6 | 1 | planet candidate (passes all tests) |
| SYN-3 | compact three-planet system around an M dwarf | 3 | 3 | planet candidate (passes all tests); planet candidate (passes all tests); planet candidate (passes all tests) |
| SYN-4 | long-period sub-Neptune around a K dwarf (six contiguous sectors) | 6 | 1 | planet candidate (passes all tests) |
| SYN-5 | eclipsing binary found at half its period (negative control) | 2 | 1 | likely false positive |
False-alarm calibration
How often does pure noise produce a detection? scripts/calibrate_false_alarms.py
simulates light curves without transits for three levels of stellar variability and two
baselines, runs the search, and records the strongest peak. The fraction whose strongest
peak passes the detection criteria is the false-alarm probability per light curve for this
noise model. Real data contain systematics that are not simulated, so real-data rates are
higher (see Limitations).
Noise-only synthetic light curves (no transits), 150 per case, searched without a stellar-density prior (the widest duration grid). A false alarm is a strongest peak with SDE ≥ 7, S/N at or above the applied threshold (the larger of 7 and the trial-corrected 1 % level), and at least two transits. In brackets: false alarms that the vetting would flag as lying at the star’s rotation period, half of it, or twice it (Lomb–Scargle of the un-detrended light curve). The last column counts light curves in which at least one stronger peak was skipped as stellar variability before the strongest peak was chosen. In every case, at least 98.8 % of the trial periods had a best box with two transits on data, the trials that standardize the SDE; dips at the edges of the data were masked in 34 of the 600 light curves.
| noise regime | sectors | median 1-h CDPP (ppm) | SDE median / 99th pct / max | S/N median / 99th pct / max | S/N threshold applied | false alarms (at P_rot) | peaks skipped as variability |
|---|---|---|---|---|---|---|---|
| quiet | 1 | 59 | 4.9 / 6.6 / 8.1 | 5.3 / 7.0 / 7.3 | 7.00 | 1/150 (0) | 21/150 |
| moderate | 1 | 173 | 4.3 / 6.3 / 6.7 | 4.9 / 8.7 / 9.3 | 7.00 | 0/150 (0) | 22/150 |
| active | 1 | 873 | 2.8 / 5.3 / 5.5 | 4.8 / 19.1 / 21.4 | 7.00 | 0/150 (0) | 93/150 |
| moderate | 3 | 170 | 5.0 / 8.2 / 8.6 | 6.1 / 11.5 / 13.8 | 7.00 | 11/150 (10) | 97/150 |
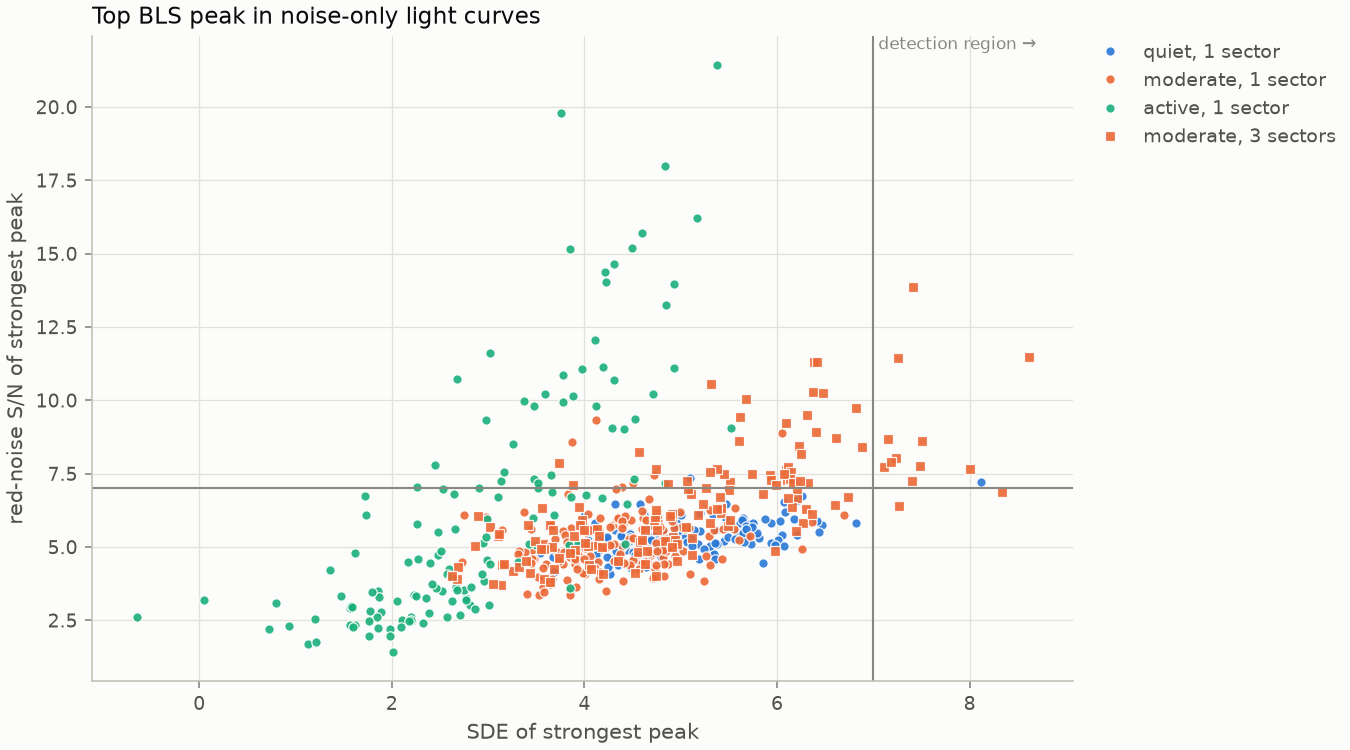
Why both SDE and S/N are required. The two statistics fail in different situations. For the most active star, detrending leaves residual rotational modulation: the red-noise S/N rates its dips as highly significant, but they do not stand out in the periodogram, so SDE stays low. For the quiet star, the strongest noise peaks sometimes stand out in the periodogram but have modest S/N. Requiring both keeps false alarms at or below 1 in 150 for single-sector light curves in all three regimes.
Spotted stars observed for longer. For the moderately active star observed for three sectors, the false-alarm rate is much higher, and all but one of the false alarms lie at the simulated rotation period (7 days) or half of it. With more data, the residual spot modulation at those periods adds up coherently enough to pass both thresholds. The brightening test in the search (see Methods) does not reject these dips, and making it stricter would also reject genuine planets. In the injection–recovery run, the strongest brightening of a recovered planet reaches 0.58 of its dip’s significance, and 0.53 for planets near the rotation period or half of it; the limit is 0.65. The vetting stage therefore warns about candidates at the rotation period, half of it, or twice it; the bracketed numbers in the table show how many false alarms it flags. Real light curves have more failure modes than these simulations, so the vetting and visual inspection of the report figures remain necessary.
False alarms on real stars
The noise-only calibration above uses simulated light curves, which have none of the
spacecraft’s systematics. scripts/measure_real_false_alarms.py runs the full pipeline on
real stars around which no planet is known and no TOI has been raised, so any detection is a
false alarm of the planet search (or a signal that is real but not a planet, such as an
eclipsing binary, which the vetting has to catch).
Selection: stars with SPOC 2-minute light curves in sectors 1 and 2; no TOI of any disposition and no confirmed planet (NASA Exoplanet Archive); TIC luminosity class DWARF; Tmag <= 11; 100 drawn at random (seed 1) from the stars sorted by TIC ID.
- Stars searched: 100 (median 1-h scatter 196 ppm)
- Stars with at least one detection: 2 (2.0 %)
- Detections: 3; stars with a detection the vetting leaves as a planet candidate: 2
- Strongest peak of the first search pass: SDE median 5.3, 99th percentile 7.8, maximum 7.9; S/N median 5.7, 99th percentile 8.5, maximum 8.8
| TIC | P (d) | depth (ppm) | S/N | SDE | transits | verdict | failed tests |
|---|---|---|---|---|---|---|---|
| 308454245 | 0.8318 | 50 | 8.5 | 7.9 | 62 | planet candidate (with caveats) | – |
| 308454245 | 0.8309 | 47 | 7.9 | 9.6 | 62 | occultation of signal 1 (phase 0.54), consistent with a planet | – |
| 281598203 | 1.2720 | 90 | 7.7 | 7.8 | 42 | planet candidate (with caveats) | – |
Two stars in a hundred gave a detection, and the vetting kept both. That is more than the synthetic calibration’s rate for one sector (1 in 450) and less than for three sectors of a spotted star (11 in 150); with two detections, the real rate is known only to within a factor of a few. Both sit just above the thresholds (S/N 7.7 and 8.5, SDE 7.8 and 7.9), and neither is a transit:
- TIC 308454245 is a hot star (Teff 10,222 K, 3.1 R☉) whose light curve is full of coherent variability: the search skipped six peaks as stellar variability. The 50 ppm dip at 0.83 days comes with a nearly equal one (47 ppm) about half an orbit later, which the search took for an occultation. Two equal dips per cycle are the pattern that a periodic variation at half that period leaves when folded at twice its period. The dip is too shallow to see in the target pixels (S/N 1.0), so the centroid test could not run, and the verdict is “with caveats”; before the centroid test existed it was “passes all tests”.
- TIC 281598203 gives a 90 ppm dip lasting 7 hours of a 1.27-day orbit. The fit needs a/R* = 1.2, a “planet” skimming the star’s surface, and the flux half an orbit later is 3.3σ above its surroundings: a wave, not a transit. The density test would have exposed it, but the TIC lists no density for the star, so the verdict is only “with caveats”.
So a signal just above the thresholds on a variable star deserves suspicion even when it passes the vetting. The five TOIs on the candidates page are far from that regime (S/N 39 and above).
Search cost
Trial-grid size, effective number of independent trials, the resulting S/N threshold, and
measured run time for one search iteration, as the amount of data grows
(scripts/benchmark_search_scaling.py).
One BLS iteration on noise-only synthetic light curves, 4 worker processes (x86_64, 4 CPUs).
| data | ρ* known | points | trial periods | effective trials | S/N threshold (trial-corrected 1 %) | time per iteration (s) | of which edge dips and eligible trials (s) | top noise peak S/N / SDE |
|---|---|---|---|---|---|---|---|---|
| 1 sector (27 d) | yes | 19010 | 12041 | 2.8e+05 | 7.00 (5.86) | 0.6 | 0.03 | 5.7 / 3.8 |
| 3 sectors (82 d) | yes | 57028 | 42991 | 1.5e+06 | 7.00 (6.14) | 2.7 | 0.07 | 5.9 / 4.9 |
| 13 sectors (356 d) | yes | 247108 | 214269 | 1.3e+07 | 7.00 (6.48) | 28 | 0.33 | 5.6 / 6.9 |
| 26 sectors over 3 years (1086 d) | yes | 494212 | 694018 | 7.1e+07 | 7.00 (6.74) | 142 | 1.00 | 5.9 / 6.1 |
| 26 sectors over 3 years (1086 d) | no | 494212 | 1015247 | 2.2e+08 | 7.00 (6.90) | 607 | 1.10 | 5.9 / 7.9 |
Peaks skipped as stellar variability before the top peak was chosen:
- 1 sector (ρ* known): P = 0.59 d, SDE 4.5: folded light curve also brightens (4.4 sigma, against 4.9 sigma for the dip): stellar variability
- 26 sectors over 3 years (ρ* known): P = 12.03 d, SDE 7.9: folded light curve also brightens (7.0 sigma, against 8.6 sigma for the dip): stellar variability
- 26 sectors over 3 years (ρ* known): P = 0.55 d, SDE 7.3: folded light curve also brightens (4.0 sigma, against 6.1 sigma for the dip): stellar variability
- 26 sectors over 3 years (ρ* unknown): P = 6.01 d, SDE 9.4: folded light curve also brightens (6.3 sigma, against 8.4 sigma for the dip): stellar variability
- 26 sectors over 3 years (ρ* unknown): P = 12.03 d, SDE 8.2: folded light curve also brightens (7.0 sigma, against 8.6 sigma for the dip): stellar variability
Finding and masking the dips at the edges of the data, and counting which trial periods can hold two transits, cost little (second-to-last column): 0.03 s of the one-sector search and 1.1 s of the three-year search without a density prior. The run times themselves vary with the machine: repeated runs differed by several percent, by up to a sixth for the shortest search, and by about a tenth between sessions on the same day.
Lessons from building the validation
Six failure modes turned up in the synthetic runs during development and were fixed before
the results above were produced. The injection–recovery runs that exposed them are kept in
results/archive/; they use the same injections as the final run, so the three
injections.csv files can be compared row by row.
- Subharmonic false alarms from detrending. In a three-year, 26-sector synthetic light curve with one planet, the second search iteration “detected” a signal at one ninth of the planet’s period. The unmasked biweight trend dips under every transit and leaves small coherent shoulders that fold constructively at P/n. Each iteration now re-detrends the raw light curve with all detected transits masked. Re-running the same simulation, the second iteration then found nothing significant. This was an exploratory run, and this specific case has no automated regression test.
- Eclipsing binaries split into two “planets”. The search picked up an eclipsing binary at its true period as two signals at the same orbital period, half an orbit apart. Because the pipeline masked each signal while vetting the other, both passed the secondary-eclipse test. Such signals, including a secondary found at P/2 once the primary is masked, are now treated as the other eclipse of the same system and kept visible to the secondary-eclipse test. The binary is then rejected (regression tests cover both the same-period and the half-period configurations).
- Strong planets reported at P/2 or 2P. The first full injection–recovery run recovered
large planets at 2–5 day periods noticeably less often than smaller ones. Every injection
larger than 3.2 R⊕ that it missed had been detected at half or twice its period. A strong
transit raises the BLS spectrum over a broad range of nearby trial periods, and the narrow
bins used for the SDE trend took that hump as the baseline, handing the peak to an alias.
The trend now uses bins of equal width in log-period, and the peak is moved to the
member of its harmonic family with the highest likelihood. Of the 768 injections larger
than 3.2 R⊕, the first run recovered 697 and the final run recovers all 768; detections
at an alias period fell from 94 to 0 (regression test:
test_strong_planet_is_reported_at_its_true_period_not_an_alias). - Starspot modulation passing as a transit. In the three-year noise-only light curve of
the search-cost benchmark, the strongest peak was a long, shallow “transit” at the
simulated star’s 12-day rotation period, and it passed both thresholds. The detrending
leaves a small coherent residual of the spot modulation, and a box fitted to one of its
troughs stacks over many rotations. Such peaks are now skipped when the folded light
curve also brightens (see Methods). This one brightens at 7.0σ against
8.6σ for the dip, and it is listed with the other skipped peaks under
Search cost (regression test:
test_coherent_stellar_modulation_is_not_a_detection). - Short-period planets skipped as variability. The first stellar-variability filter
skipped a peak when a sinusoid at its period captured more than half of the box model’s
likelihood gain. While re-running the injection–recovery test, planets with periods of
0.5–0.6 days went missing. At such short periods the box fitted to a transit spans
10–20 % of the orbit, and a genuine box of that duty cycle already puts 21–44 % of its
variance into its fundamental; noise pushed marginal cases over 50 %. The run was
stopped (regression test:
test_short_period_planet_is_not_mistaken_for_variability). - Planets near the rotation period skipped as variability. The second filter compared
the light curve’s sinusoid at the peak’s period with the one a box-shaped dip implies.
Its injection–recovery run was stopped after 1,159 injections: it missed 10 that the
first run had recovered, 9 of them at periods of 4.35–5.14 or 9.86–9.94 days, near the
simulated star’s 10-day rotation period and its 5-day harmonic. Residual spot
modulation at those periods inflated the sinusoid, so the transits were skipped as
variability. The folded-brightening test that replaced it (see Methods)
recovers all 9; their strongest brightenings reach at most 0.53 of the dip’s
significance (regression test:
test_planet_at_half_the_rotation_period_is_not_mistaken_for_variability).
Overall, the final run recovers 1,469 of the 2,048 injections, against 1,372 in the first run, which had neither the alias fix nor any variability filter. It misses one injection that the first run recovered: a 2.3 R⊕ planet on a 16.2-day orbit, found at the right period with SDE 6.71, just under the threshold of 7.