Synthetic transits are multiplied into a light curve before detrending, and the full
detrend + iterative BLS search is run exactly as for a real target
(scripts/run_injection_recovery.py; method in Methods).
An injection counts as recovered only if a detected signal matches its period to
within 1 % and a mid-transit time falls within half a transit duration of an injected
transit. Detections at 1/2, 2, 1/3, or 3 times the period are recorded separately as aliases
and are not counted as recoveries. Tables list the percentage recovered, with the number
recovered / injected in brackets. The table is the exact numerical twin of the figure.
Synthetic TESS-like light curve
A simulated two-sector light curve of a Sun-like star with white noise, correlated noise, and rotational modulation. It has no instrumental systematics, so this map is an upper limit on real-data completeness at the same noise level.
The static figure and the exact table, generated from results/:
2048 injections (0.7–8 R⊕, 0.5–20 d) into a synthetic TESS-like light curve of a G dwarf: 38020 points over 54.8 days; robust scatter of the flattened light curve 0.5h: 185 ppm, 1h: 140 ppm, 2h: 99 ppm. Overall recovery: 71.7 %; 0 injections were found only at an alias period.
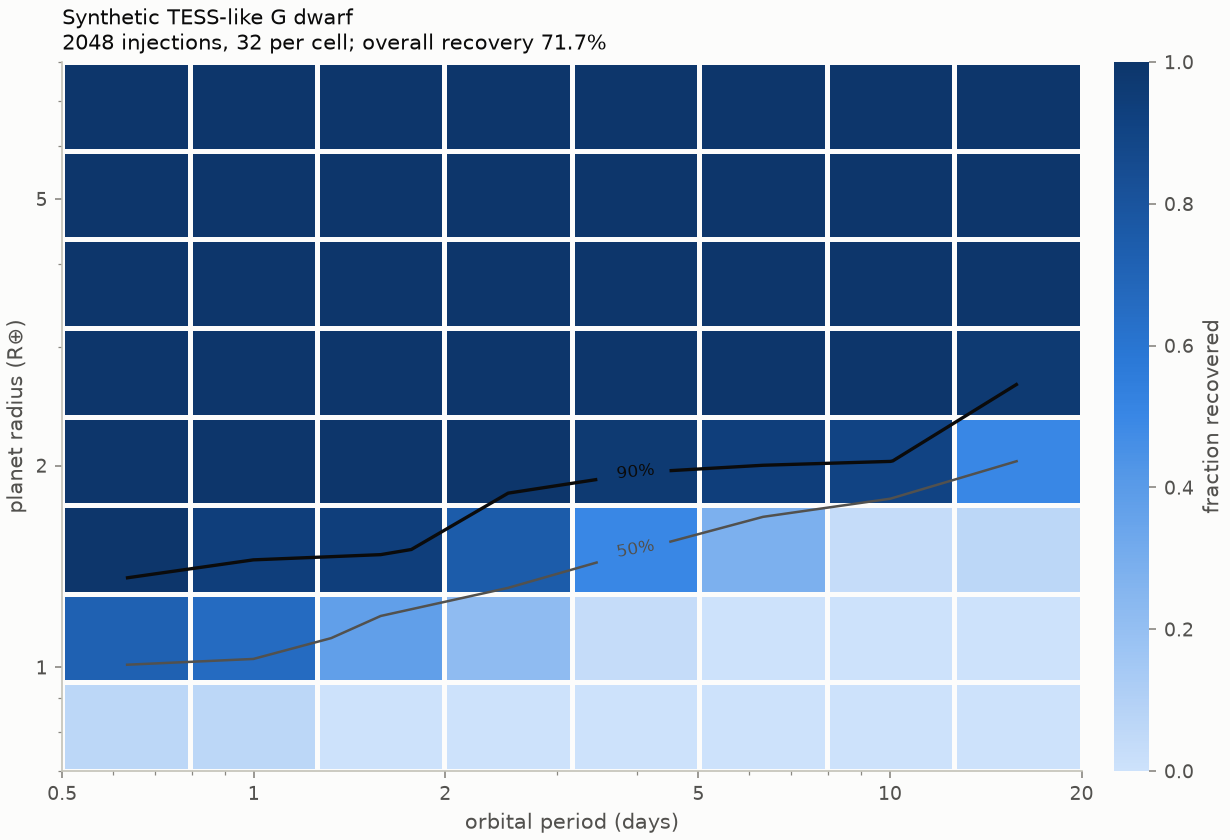
| R_p (R⊕) \ P (d) | 0.5–0.793 | 0.793–1.26 | 1.26–1.99 | 1.99–3.16 | 3.16–5.01 | 5.01–7.95 | 7.95–12.6 | 12.6–20 |
|---|---|---|---|---|---|---|---|---|
| 5.9–8 | 100% (32/32) | 100% (32/32) | 100% (32/32) | 100% (32/32) | 100% (32/32) | 100% (32/32) | 100% (32/32) | 100% (32/32) |
| 4.35–5.9 | 100% (32/32) | 100% (32/32) | 100% (32/32) | 100% (32/32) | 100% (32/32) | 100% (32/32) | 100% (32/32) | 100% (32/32) |
| 3.21–4.35 | 100% (32/32) | 100% (32/32) | 100% (32/32) | 100% (32/32) | 100% (32/32) | 100% (32/32) | 100% (32/32) | 100% (32/32) |
| 2.37–3.21 | 100% (32/32) | 100% (32/32) | 100% (32/32) | 100% (32/32) | 100% (32/32) | 100% (32/32) | 100% (32/32) | 97% (31/32) |
| 1.75–2.37 | 100% (32/32) | 100% (32/32) | 100% (32/32) | 100% (32/32) | 97% (31/32) | 94% (30/32) | 91% (29/32) | 50% (16/32) |
| 1.29–1.75 | 100% (32/32) | 94% (30/32) | 94% (30/32) | 75% (24/32) | 50% (16/32) | 28% (9/32) | 3% (1/32) | 6% (2/32) |
| 0.949–1.29 | 72% (23/32) | 66% (21/32) | 38% (12/32) | 22% (7/32) | 3% (1/32) | 0% (0/32) | 0% (0/32) | 0% (0/32) |
| 0.7–0.949 | 6% (2/32) | 6% (2/32) | 0% (0/32) | 0% (0/32) | 0% (0/32) | 0% (0/32) | 0% (0/32) | 0% (0/32) |
Real TESS light curve
The same injections, into two sectors (1 and 2) of HD 21749 (TIC 279741379), a K dwarf of 0.71 R☉. The transits of its two known planets are masked first, so that they are neither recovered nor mistaken for injections. Two sectors match the synthetic light curve above.
2048 injections (0.7–8 R⊕, 0.5–20 d) into the SPOC 2-minute light curve of TIC 279741379, sectors 1, 2, known planets masked: 36526 points over 56.2 days; robust scatter of the flattened light curve 0.5h: 112 ppm, 1h: 88 ppm, 2h: 73 ppm. Overall recovery: 80.6 %; 2 injections were found only at an alias period.
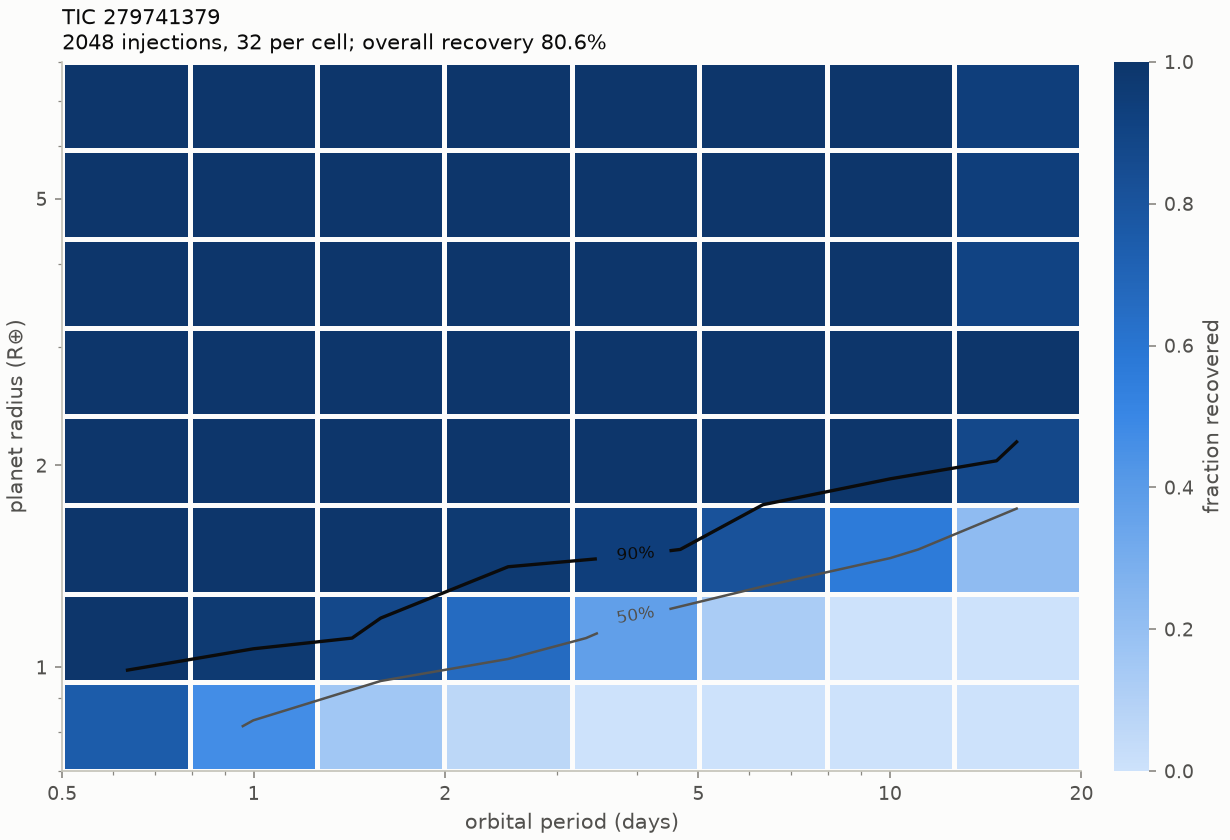
| R_p (R⊕) \ P (d) | 0.5–0.793 | 0.793–1.26 | 1.26–1.99 | 1.99–3.16 | 3.16–5.01 | 5.01–7.95 | 7.95–12.6 | 12.6–20 |
|---|---|---|---|---|---|---|---|---|
| 5.9–8 | 100% (32/32) | 100% (32/32) | 100% (32/32) | 100% (32/32) | 100% (32/32) | 100% (32/32) | 100% (32/32) | 94% (30/32) |
| 4.35–5.9 | 100% (32/32) | 100% (32/32) | 100% (32/32) | 100% (32/32) | 100% (32/32) | 100% (32/32) | 100% (32/32) | 94% (30/32) |
| 3.21–4.35 | 100% (32/32) | 100% (32/32) | 100% (32/32) | 100% (32/32) | 100% (32/32) | 100% (32/32) | 100% (32/32) | 91% (29/32) |
| 2.37–3.21 | 100% (32/32) | 100% (32/32) | 100% (32/32) | 100% (32/32) | 100% (32/32) | 100% (32/32) | 100% (32/32) | 100% (32/32) |
| 1.75–2.37 | 100% (32/32) | 100% (32/32) | 100% (32/32) | 100% (32/32) | 100% (32/32) | 100% (32/32) | 100% (32/32) | 88% (28/32) |
| 1.29–1.75 | 100% (32/32) | 100% (32/32) | 100% (32/32) | 97% (31/32) | 94% (30/32) | 81% (26/32) | 56% (18/32) | 22% (7/32) |
| 0.949–1.29 | 100% (32/32) | 97% (31/32) | 88% (28/32) | 66% (21/32) | 38% (12/32) | 12% (4/32) | 0% (0/32) | 0% (0/32) |
| 0.7–0.949 | 75% (24/32) | 47% (15/32) | 16% (5/32) | 6% (2/32) | 0% (0/32) | 0% (0/32) | 0% (0/32) | 0% (0/32) |
Real against synthetic
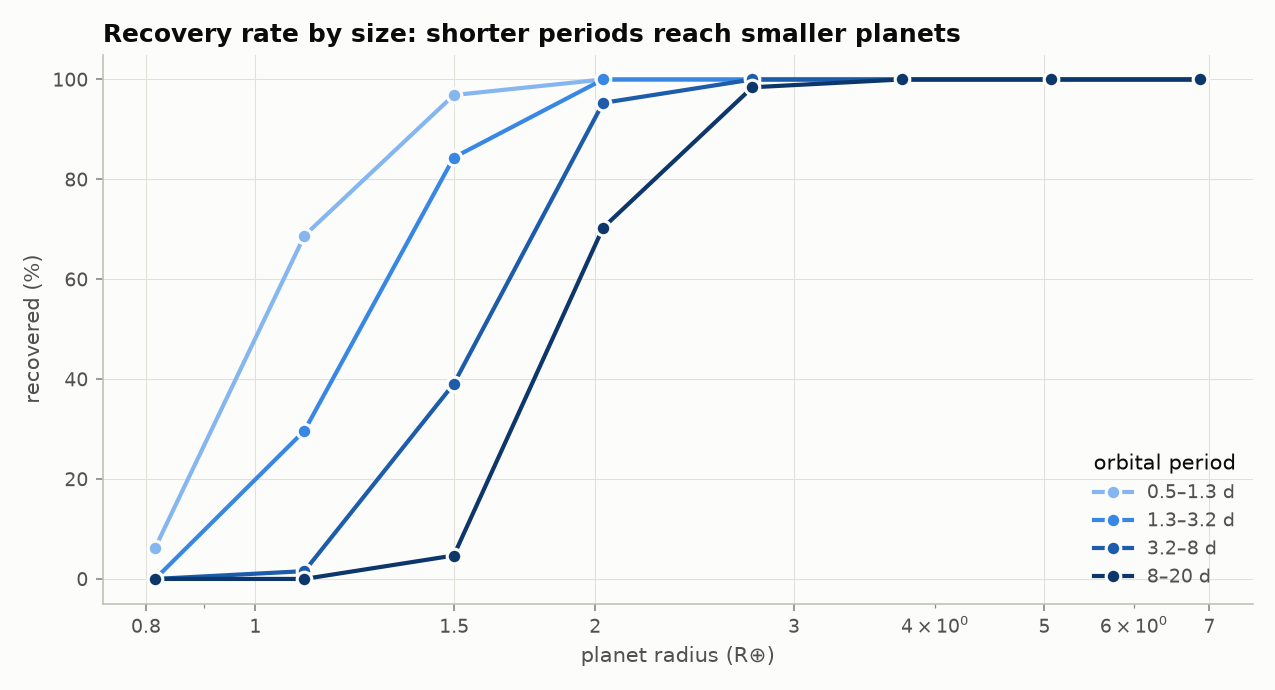
Overall, 80.6 % of the injections into HD 21749’s light curve are recovered, against 71.7 % for the synthetic G dwarf. Below about 2.4 R⊕ the real map is the more complete, radius for radius, but not because real data are cleaner. HD 21749 is smaller than the simulated star (0.71 against 1.0 R☉), so the same planet makes a transit about twice as deep, and its light curve is quieter (88 against 140 ppm per hour). The two maps therefore do not show what real systematics cost; that would need injections into a simulated light curve of the same star.
Three differences do come from the real data (injections.csv in each folder):
- Gaps. Eight injections at 12.6–20 days had fewer than two transits in the data, against none in the synthetic light curve, because sector gaps and the masked transits of HD 21749’s own planets remove data. They account for four of the seven misses among planets larger than 3.2 R⊕.
- Instrumental dips. The search masks strong single dips that the data do not cover on both sides and that lie next to a long gap (Search). Compared with a run without that mask and with the SDE measured against every trial period, 18 more injections are recovered, all of them planets of 0.7–2.0 R⊕ whose peaks now reach SDE 7, and 4 fewer. One of those 4 had only two transits in the data, one of them next to a gap, so it was masked as if it were an instrumental dip; it is one of the seven misses above. For the other three, a real instrumental dip had landed on one of their transits and inflated its S/N. A first version of the mask, which also masked dips cut by short gaps inside a data segment, lost three more planets with two or three transits in the data.
- Aliases. Two injections were found only at an alias of their period, against none in the synthetic run.
Two sectors are also far less than the 15 the validation searched for this star. At the size and period of HD 21749 c (0.89 R⊕, 7.8 days), no injection is recovered in two sectors (0 of 32 in that cell), while in 15 sectors the search finds the planet at S/N 19.9 (Validation). More data make it detectable, once the instrumental dips that hid it in the first run are masked.
Interpreting the maps
- Completeness falls with radius because depth scales as (Rp/R*)². It falls with period
because fewer transits are observed, and the S/N grows only as the square root of their
number. In light curves with long gaps, some long-period injections also have fewer
than the two transits a detection requires (
n_transits_in_dataininjections.csv). - The limiting S/N is set by the detection criteria (SDE ≥ 7, red-noise S/N ≥ max(7, trial-corrected level)), not by the injection grid.
- The per-injection results, including the found period, S/N, SDE, and the number of
injected transits that fell in the data, are in
injections.csvin each results folder.