Where the photons come from
TESS looks at one 24° × 96° strip of sky, a sector, for about 27 days, then moves on.
For a few hundred thousand pre-selected stars it saves a brightness measurement every
2 minutes. NASA’s Science Processing Operations Center (SPOC) turns the pixels into
light curves, and the pipeline downloads every SPOC 2-minute sector for the requested star
with lightkurve.
The flux used is PDCSAP (Pre-search Data Conditioning Simple Aperture Photometry). PDC has already removed spacecraft systematics that are common to many stars and has corrected two things that would otherwise bias the planet’s size:
- Crowding (
CROWDSAP): light from neighboring stars that falls in the aperture. Extra light makes a transit look shallower. - Flux fraction (
FLFRCSAP): the part of the target’s light that falls outside the aperture.
After these corrections a transit’s depth can be compared directly with the physical (Rp/R*)².
Cleaning
Three things happen to every sector:
- Quality mask. Cadences with any of the default QUALITY bits are dropped: attitude tweaks, safe mode, coarse pointing, Earth pointing, Argabrightening, reaction-wheel desaturations (momentum dumps), manual excludes, impulsive outliers and bad calibration. A unit test checks that this matches lightkurve’s own default bitmask. Points with a non-finite time, flux or uncertainty go too.
-
Normalization. Each sector is divided by its median, so that the flux is a fraction of the star’s typical brightness:
\[f_i \;\rightarrow\; \frac{f_i}{\operatorname{median}(f)}\] - Outlier clipping, upward only. A running median over 0.5 days gives a local trend \(T_i\). The scatter is measured robustly with the median absolute deviation, which a few wild points cannot inflate:
A point is removed if \(r_i > 4\,\sigma_{\text{rob}}\). The process repeats until the set of flagged points stops changing.
Why only upward?
Cosmic rays, flares and scattered-light glints make points brighter. A transit is a run of consecutive points that are fainter, and a deep one sits tens of sigma below the trend. A symmetric clip deletes exactly the signal the pipeline is looking for:
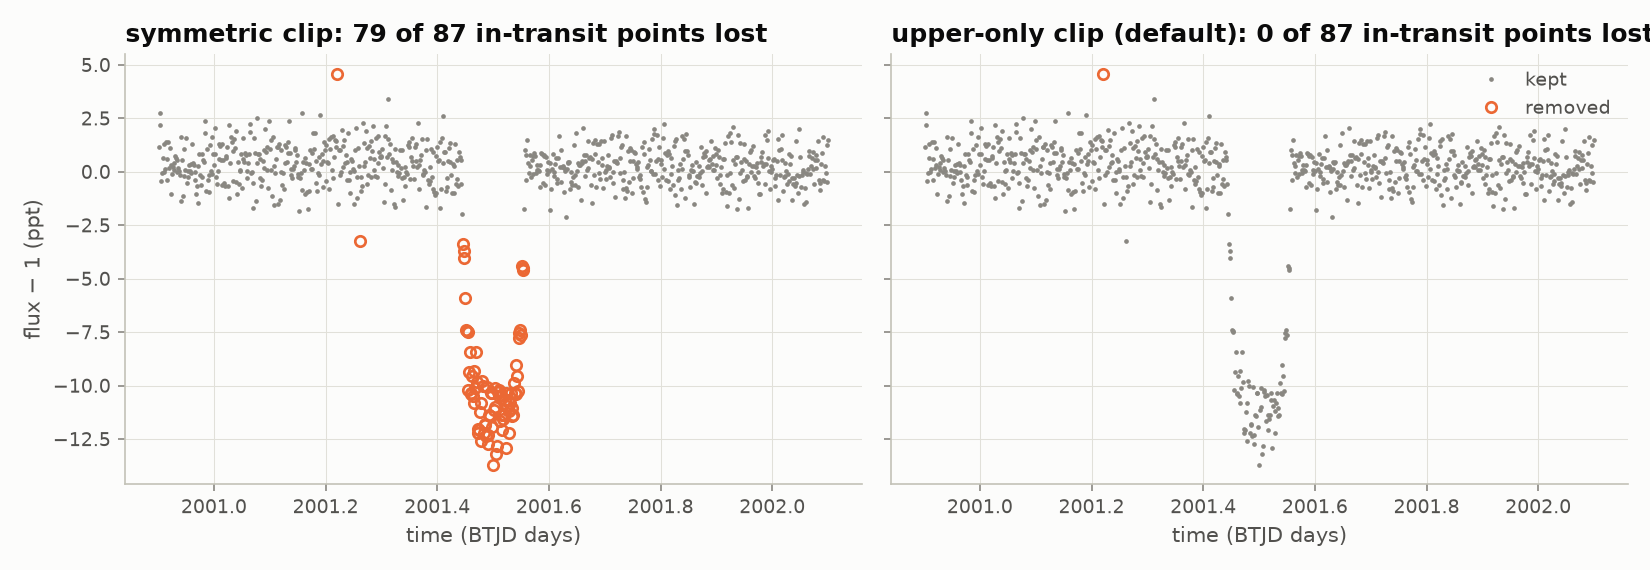
scripts/make_site_figures.py with the pipeline's own find_outliers.Caching and provenance
The raw FITS files stay in lightkurve’s download cache. The cleaned, stitched light curve is
saved as a compressed .npz, keyed by a hash of the cleaning settings, so a changed setting
never silently reuses stale data. Each cache file records per-sector bookkeeping (points
kept, points flagged, crowding values), the cleaning configuration and software versions,
and every report.json repeats that provenance.
transit-hunter fetch --tic 261136679 # download, clean and cache only
The cache lives in ~/.cache/transit_hunter; set TRANSIT_HUNTER_CACHE or --cache-dir to move it.